Fed Officials Tell Markets the Training Wheels Are Off - After years of telling markets what to expect on the interest-rate front, Federal Reserve officials are telling traders and investors to figure out the outlook on their own. The influential presidents of the New York and San Francisco regional Fed banks seemed eager Tuesday to offer lessons in how market participants should be thinking about central bank policy. Until their March policy meeting, Fed officials had used code such as”patient” and “considerable time” to guide market participants on how long the central bank might wait before lifting short-term interest rates from near zero. By dropping such language, the Fed has made clear it can consider raising rates at any coming meeting, and the decision will depend on how economic data affect the policy makers’ forecasts. They have said they want to be confident the labor market is improving and inflation will rise toward their 2% target. What the Fed wants to achieve is “well specified” and “market participants should be able to think right along with policymakers, adjusting their views about the prospects for normalization in response to the incoming data,” New York Fed President William Dudley said in a speech early Tuesday in Zurich. “The timing of liftoff will depend on how the economic outlook evolves. Since the economic outlook is uncertain, this means the timing of liftoff must also be uncertain,” Mr. Dudley said. Ultimately, the first rate rise should “not be a big surprise” when it happens, he said. Still, Fed officials have noted there has been a disconnect between what they expect for short-term rates and what investors are pricing in. At various points in recent months, markets have expected a less aggressive series of rate rises than central bankers have been predicting. San Francisco Fed President John Williams, speaking in New York Tuesday, said, “we have to accept the fact that market participants will come to their own conclusions” about the outlook, Mr. Williams said.
Fed’s Williams Tells CNBC Not to Expect Warning of Coming Rate Hikes - Federal Reserve Bank of San Francisco President John Williams told a television channel Monday that the U.S. central bank is unlikely to provide much warning ahead of an increase in short-term interest rates. Instead, the official told CNBC that officials will need to go into every policy meetings with an open mind. “We should be coming together every six weeks, discussing what the outlook looks like, and what the right appropriate policy decisions at that meeting are, and adjusting policy” accordingly, Mr. Williams said. The Fed needs “to get out of this business of telegraphing our decisions in advance” and make sure that monetary policy is truly driven by and responsive to incoming economic data. Mr. Williams said rate rises are “on the table at every meeting” but he would not suggest action is likely to happen at any particular point, although he did say a year from now he believes short-term rates will have moved up off of their current near zero levels. “You don’t want to make a decision three months in advance and announce that decision when you really have more time to collect data and make the most informed decision you can,” Mr. Williams said. The official also noted that he accepts that a lack of firm guidance from central bankers could generate more volatility in financial markets. “We don’t want to be adding noise,” but at the same time, “we don’t want to be absolutely eliminating all uncertainty about our future actions. It’s healthy for the future actions to be uncertain because future conditions can change,” Mr. Williams said.
Fed’s Dudley: Markets Shouldn’t Be Surprised When Fed Hikes Rates - Federal Reserve Bank of New York President William Dudley said Tuesday markets shouldn’t be surprised when the U.S. central bank gets around to raising short-term interest rates. The conditions that will determine the timing of the Fed raising rates from their current near-zero levels are “well specified” and “market participants should be able to think right along with policymakers, adjusting their views about the prospects for normalization in response to the incoming data,” Mr. Dudley said in the text of a speech to be delivered in Zurich. “This implies that liftoff should not be a big surprise when it finally occurs, which should help mitigate the degree of market turbulence engendered by lift-off,” Mr. Dudley said. The central banker, who also serves as vice-chairman of the monetary-policy setting Federal Open Market Committee, also reiterated that he can give no firm guidance about when rates will go up. In a late April speech the official said that “hopefully” that can happen this year, but on Tuesday he explained that when it comes to the boost in borrowing costs, “I don’t know when this will occur.” Mr. Dudley explained “the timing of lift-off will depend on how the economic outlook evolves. Since the economic outlook is uncertain, this means the timing of liftoff must also be uncertain.” Mr. Dudley’s comments were made before a gathering called the 6th High Level Conference on the International Monetary System. The official spoke as policymakers have continued to drive home the point that a rate rise could happen at any Fed meeting over the course of this year. That said, there remains considerable uncertainty about the outlook for monetary policy in the wake of data showing a weak start to the year. Many in markets believe the Fed could raise rates in the late summer or early fall.
Exit Strategy, Part One: ZIRP - The Fed has announced plans to raise rates in the imminent future, but the market does not believe it. Why not? Conventional wisdom appears to be that the Fed will chicken out, just as it did during the so-called Taper Tantrum. I want to suggest a slightly different source of disconnect, concerning expectations about what exactly will happen in the monetary plumbing when the Fed raises rates. Case in point is the recent Credit Suisse memo, apparently the first of a series, that forecasts “a much larger RRP facility–think north of a trillion” whereas the FOMC itself “expects that it will be appropriate to reduce the capacity of the [RRP] facility soon after it commences policy firming”. That’s a pretty big disconnect. Pozsar and Sweeney (authors of the CS memo) think about the exit from ZIRP (Zero Interest Rate Policy) from the perspective of wholesale money demand, which they insist is “a structural feature of the system” and “the dominant source of funding in the US money market”. Capital regulations have made the bank side of the business unprofitable, and looming requirements that prime money funds mark to market (so-called floating NAV rather than constant NAV) will force them out of the business as well. Where is that money demand going to go? Pozsar and Sweeney say it will go directly to the Fed, causing the swelling of the Reverse Repo Facility pari passu with the shrinking of excess reserves. The mechanism will be a shift from prime money funds and bank deposits into government-only money funds, which will absorb the flow by accumulating RRP.In other words, the Fed will not be able to shrink its balance sheet as part of this first stage of exit from quantitative easing. It will only be able to shift the way that balance sheet is funded–much less excess reserves held by banks, much more RRP held by government-only money funds. Nevertheless, because this shift will allow the Fed to regain control over the Fed Funds rate, it will accept that consequence. Exit from ZIRP comes before exit from QE.
Debt Traders to Fed: We Dare You to Try Raising Rates This Year -- Go ahead, Federal Reserve, keep trying to prepare markets for an interest-rate increase this year. It isn’t working. The longer U.S. central bankers wait to initiate their tightening cycle, the more traders push back their expectations for when borrowing costs will start rising. On Thursday, futures contracts were implying that traders saw the fed funds rate at about 0.3 percent rate by December. That’s the lowest estimate of the year, and about half the forecast for the overnight lending benchmark that the Fed gave in March. The market is essentially calling the Fed’s bluff. Traders are betting that policy makers won’t be able to raise rates this year without disrupting stocks and bonds, something that they’d really rather not do. So either U.S. policy makers will have to risk another market-wide tantrum, or they’ll give in to traders who embrace the idea of these historically low borrowing costs sticking around for longer. “In the end, the Fed is more likely to ‘cave’ to the market as opposed to ‘fight it’ by hiking when the market does not have it priced in,” Jim Bianco, president of Bianco Research LLC, said in an e-mail. The Fed still sees low rates “as beneficial and does not want to undermine all the work they have done over the past several years.” In the meantime, Fed members are amping up their rhetoric that yes, a rate hike is coming, yes, it’ll probably be this year, and no, it may not be an easy ride for markets.
The Senate Moves Ahead on a Policy Rules Bill - John Taylor - Today the Chairman of Senate Banking Committee, Richard Shelby, released a draft bill entitled “The Financial Regulatory Improvement Act of 2015” covering a wide range of reforms. Like the widely-discussed House policy rules bill (Section 2 of HR 5018 of last year), this Senate bill (in the first section of Title V) would require that the Fed report on monetary policy rules. In fact, the Senate bill contains important principles regarding policy rules that are in the House Bill and should be ripe for compromise in conference. Recall that the House bill, as I described in testimony before the Senate Banking Committee in March, “would require that the Fed ‘describe the strategy or rule of the Federal Open Market Committee for the systematic quantitative adjustment’ of its policy instruments. It would be the Fed’s job to choose the strategy and how to describe it. The Fed could change its strategy or deviate from it if circumstances called for a change, but the Fed would have to explain why.” The Senate bill is quite similar in these essentials. First, it would require that the Fed report each quarter to Congress “a description of any monetary policy rule or rules used or considered by the Committee that provides or provide the basis for monetary policy decisions, including short-term interest rate targets set by the Committee…” with the stipulation that “such description shall include, at a minimum, for each rule, a mathematical formula that models how monetary policy instruments will be adjusted based on changes in quantitative inputs…” Second, it would require in each quarterly report “a detailed explanation of any deviation in the rule or rules…from any rule or rules…in the most recent quarterly report.” And to emphasize that rules and strategies have similar meanings, the bill includes a corresponding requirement to report on any monetary policy strategy or strategies. In other words, as in the House bill, the Fed could change strategies or rules, but it would have to explain why.
Shelby’s Fed Reform Bill Is Just Moving Deck Chairs on the Titanic - Senator Richard Shelby, Chair of the Senate Banking Committee, is set to release details of his proposed financial reform legislation today which Wall Street hopes will have so much smoke and mirrors to appease the liberal and conservative factions on the Committee that no one will notice that it’s another big sellout to Wall Street. The bill will hold out the promise of reforming the Federal Reserve while failing to do anything material to reform it. It will promise to remove unnecessary regulatory burdens on community banks so that they can survive and compete while leaving intact the very financial structure that is killing off community banks faster than you can say Dodd-Frank. The biggest joke in the proposed legislation is that the Fed will somehow be tamed by allowing the President of the United States to nominate, with Senate confirmation, the President of the New York Fed – the organization that is effectively running the Fed from New York by following the marching orders of the mega Wall Street banks. President Obama’s nominations, with Senate confirmation, have not exactly been a boon to the American people when it comes to other overseers of Wall Street like the Treasury Secretary, the SEC Chair, or the Vice Chairman of the Federal Reserve – all of whom had egregious Wall Street conflicts but were installed anyway.
Fed’s Biggest Fears Don’t Materialize in Overhaul Legislation, Yet -- Chairwoman Janet Yellen and other Federal Reserve leaders haven’t exactly welcomed the idea of overhauling the central bank. But many of the proposals that most raised their hackles didn’t make it into draft legislation unveiled Tuesday by Sen. Richard Shelby (R., Ala.). “I don’t see anything in here that would impinge on the Fed’s arm’s-length relationship with the short-term political pressures and its independence within the democratic system,” said Donald Kohn, former vice chairman of the Fed. He said there are parts of the bill he doesn’t like, but that he could see the Fed living with most of it. Still, he and other Fed watchers noted the risk that more divisive measures could be introduced as the bill makes its way through Congress, such as restrictions on the Fed’s emergency lending power. “I’d be hoping that this thing wouldn’t get dragged in a direction that would be adverse to Federal Reserve independence in a Senate-House conference committee,” Mr. Kohn said. Mr. Shelby, the powerful chairman of the Senate Banking Committee, on Tuesday released a wide-ranging proposal to ramp up oversight of the Fed and rewrite bank regulations. Among other things, it would make the New York Fed president a Senate-confirmed presidential appointee, require Federal Open Market Committee transcripts to be released after three years instead of the current five, establish a commission to study possible changes to the Fed’s 12-district regional system and require more frequent, detailed reports on monetary-policy decision-making. The draft bill, however, didn’t include many of the measures kicking around Capitol Hill that the Fed finds most objectionable, including bills to force the central bank to adopt a formal policy rule or to introduce Government Accountability Office audits of monetary-policy matters.
Fed faces limits on lending powers during crises - FT.com: The Federal Reserve’s ability to give emergency loans to distressed institutions in a crisis would be restricted under legislation being prepared by lawmakers who want to stop “backdoor bailouts”. The proposed legislation — a striking challenge to the Fed from a bipartisan pair of senators — will reignite debate over whether the US succeeded in ending banks’ “too big to fail” status with its response to the financial crisis. The Fed contained panic during the crisis by offering emergency loans to institutions facing liquidity crunches. But, after the meltdown, Congress introduced restrictions to prevent the bailout of single struggling entities, while preserving Fed powers to provide liquidity to groups of firms. It also gave regulators new powers to manage the orderly wind-down of major financial institutions that are insolvent and threaten financial stability. The new bill is rooted in concern among some lawmakers that the Fed is defying the law’s intent. They say its proposed implementation plan would not curb its lending powers or eliminate the moral hazard created by the promise of government aid. The bill is being drafted by an odd couple of US senators from opposing ends of the political spectrum: Elizabeth Warren, a liberal firebrand from Massachusetts, and David Vitter, a staunch conservative from Louisiana. It could be introduced by the senators as early as Tuesday, according to people familiar with it. It represents a worrying new threat for a central bank already under fire from some Republicans calling for reforms to improve its transparency.
Senate Duo Takes Aim at Fed’s Lending Powers - A bipartisan Senate duo is taking aim at the Federal Reserve’s ability to make emergency loans to financial institutions. Sens. David Vitter (R., La.) and Elizabeth Warren (D., Mass.) introduced legislation Wednesday that would restrict the central bank’s ability to intervene in the event of a financial crisis without congressional approval. Sen. Elizabeth Warren (D., Mass.) on Tuesday.The bill would require any Fed emergency-lending effort be open to at least five or more institutions. Loans would have to be set at five percentage points above similar Treasury securities. Those requirements could be waived by a vote of Congress. Fed lending programs that waive those requirements, however, would expire within 30 days if Congress doesn’t approve them. The bill also restricts lending only to those institutions that aren’t insolvent. The Fed would have to analyze institutions’ assets and liabilities over the past four months and provide a written explanation before issuing the loans. Overall, the measure ensures that lawmakers would get a say on expansive central bank rescue programs such as those the Fed put in place during the 2008 financial crisis. Mr. Vitter and Ms. Warren have criticized the Fed’s efforts during the crisis, writing to the central bank in an August letter that was signed by 15 lawmakers that its interventions were “a bailout in all but name.” The Fed didn’t immediately respond to a request for comment on the bill.
Elizabeth Warren's Next Crusade: Clamping Down On The Federal Reserve's 'Too Big To Fail' Bailouts --After the financial crisis, protesters nationwide filled streets with the chant, “Banks got bailed out, we got sold out.” The sentiment still resonates in Congress. On Wednesday, Sens. Elizabeth Warren, D-Mass., and David Vitter, R-La., proposed curbs on the Federal Reserve’s ability to extend emergency financing to ailing firms. The bipartisan legislation comes as some lawmakers argue the 2010 Dodd-Frank Act was a regulatory overreach, while others worry it failed to end the era of “too big to fail” banks. A day after Sen. Richard Shelby, R-Ala., unveiled legislation that would roll back some key Dodd-Frank policies, Warren and Vitter have taken the opposite tack. "It's no secret that Too Big to Fail is still around,” Vitter said in a statement. “If another financial crisis happened tomorrow -- and that's still a real risk -- nobody doubts that megabanks would be calling on the federal government to bail them out again.” The Fed’s bailout powers, which were dialed back by the Dodd-Frank, would be further constrained under the bill, called the Bailout Prevention Act. Under the proposed legislation, the Fed would have to seek congressional approval within 30 days of making any extraordinary loans to distressed institutions. Bailed-out firms would also be forced to pay a penalty interest rate 5 percent above a Treasury benchmark, a departure from the bargain rates they paid after the crisis.
New Fed Bill Is Like ‘Shutting Down the Fire Department to Encourage Fire Safety,’ Bernanke Says - Former Federal Reserve Chairman Ben Bernanke struck back at a bipartisan Senate bill designed to rein in the central bank’s emergency-lending powers. In a post Friday on his Brookings Institution blog, Bernanke called the proposal from Sens. David Vitter (R., La.) and Elizabeth Warren (D., Mass.) “roughly equivalent to shutting down the fire department to encourage fire safety.” “The bill would further restrict the Federal Reserve’s emergency lending powers in a financial crisis,” he wrote. “That would be a mistake, one that would imprudently limit the Fed’s ability to protect the economy in a financial panic.” The two senators introduced the bill Wednesday to limit the Fed’s ability to pump money into troubled financial institutions during times of crisis. The two have criticized the Fed’s lending programs during the last crisis, saying they made banks more likely to take risks.The bill requires Fed lending programs to be broad-based and open to at least five institutions. The interest rate on those loans would have to be set at least five percentage points above similar Treasury rates. Fed officials could only waive those restrictions if Congress approves. The bill also mandates that loans be limited to solvent institutions. The Fed and other bank regulators would have to certify in writing that borrowers are not insolvent. In practice, Bernanke argued, that would mean publicly disclosing the borrowers and exposing them to the stigma of having to borrow from the central bank. Under the provisions outlined in the bill “borrowing from the central bank will be self-defeating, and firms facing runs will do all they can to avoid it,” Bernanke wrote.
Chicago Fed Says Natural Jobless Rate At Or Under 5%, Will Fall Further Over Time -- Economists at the Chicago Fed argue in a new paper the U.S. economy remains even farther from a truly hot labor market than many central bankers think. The economy’s so-called natural unemployment rate likely lies at or below 5%, and it will go even lower over time, the analysts say in a note published Monday. The natural rate—sometimes called the full-employment rate or the long-term rate—is the lowest level of unemployment that does not generate higher inflation. It is hard to determine and changes over time, vexing Federal Reserve officials who are considering it as they debate when to raise short-term interest rates from near zero. The Chicago Fed’s analysis contrasts with the collective view of Fed officials, who estimate the long-run unemployment rate ranges between 5% and 5.2%. The national jobless rate was 5.4% in April. All this matters greatly to the Fed because of the implications for interest rates. Many policy makers say they want to raise interest rates before hitting the full employment rate, all else being equal, to keep price pressures from accelerating too quickly. . The problem is, divining the natural rate is tricky. Doing so relies in part in unmeasurable things like the economy’s potential growth rate, which depends in part on demographic trends and labor market patterns. The Chicago Fed paper says “significant labor market slack remains” in the U.S. despite a rapid decline in the unemployment rate. That means there are lots of people available to work or work longer hours if they got the chance, such as folks who are working part time involuntarily or who have stopped looking for work because they got discouraged in the past. This points to a natural rate of 5% or lower, the authors said in the research note. The analysts said key evidence for their conclusion is the recent modest pace of U.S. wage gains.
The biggest risk to US growth: further dollar rally - The biggest risk to US economic growth remains the possibility of an extended US dollar rally. The Fed rate hike expectations have been pushed out to December and many doubt that the Fed will hike right before the year end. That's because the hike will involve three rates: FF, IOER, and RRP and could be disruptive to money markets over the turn (year-end). That means if we don't get a hike in September, we may not see liftoff until 2016. At least that's what the markets expect. But if the Fed unexpectedly hikes this summer, the impact on the markets could be severe. And the dollar is likely to rally further as a result. We've seen what a strong dollar can do to US manufacturing employment. But there are other "unintended consequences". Consider for example US farming businesses and the banks that provide them credit. It's hard for US farmers to compete with Canadian, Australian, Ukrainian, and other foreign producers after those nations' currencies have been sharply devalued vs. the dollar. That's why grain prices, farms, and banks that lend to them are vulnerable to further US dollar strength.
Weak retail sales dampen sharp Q2 growth rebound hopes - U.S. retail sales were flat in April as households cut back on purchases of automobiles and other big-ticket items, the latest sign the economy was struggling to rebound strongly after barely growing in the first quarter. The weaker-than-expected retail sales report from the Commerce Department, and other data on Wednesday showing the 10th straight month of declining import prices in April, suggest little urgency for the Federal Reserve to start raising interest rates. "Hopes for a strong rebound are now fading. The likelihood of a near-term Fed action is almost zero now," said Thomas Costerg, an economist at Standard Chartered Bank in New York. While March's retail sales were revised higher to show a 1.1 percent increase instead of the previously reported 0.9 percent rise, that was not enough to offset the general weak tone of the report. Economists had forecast sales up 0.2 percent in April. Futures markets continued to show that traders do not expect an interest rate hike until December at the earliest. The dollar fell against a basket of currencies, while prices for U.S. Treasury debt slipped. U.S. stocks were little changed. Retail sales excluding automobiles, gasoline, building materials and food services were also unchanged after an upwardly revised 0.5 percent increase in March.
Q2 GDP Forecast Cut To 0.7% By Atlanta Fed -- Zero Hedge first brought attention to the Atlanta Fed over two months ago, when the first massive divergence between bullish consensus and objective reality appeared. Since then it has been nothing but a downhill race for reality, with consensus scrambling to catch up. Moments ago, the Atlanta Fed just cut its Q2 GDP forecast once more, this time to 0.7% from 0.8%. This is on the back of a Q1 GDP which as of this moments is around -1.0%. From the Atlanta Fed: The GDPNow model forecast for real GDP growth (seasonally adjusted annual rate) in the second quarter of 2015 was 0.7 percent on May 13, down slightly from 0.8 percent on May 5. The nowcast for second-quarter real consumer spending growth ticked down 0.1 percentage point to 2.6 percent following this morning's retail sales report from the U.S. Census Bureau. This means that the consensus will once again have to scramble and consult the Oracle Stone in their catch down to the Atlanta Fed.It also means that the first half US GDP print will be negative and all else equal, would suggest a technical recession. It also means that for 2015 full year GDP to print at a "growing" 2.5%, the economy will have to grow at 5% or higher in both Q3 and Q4.
US Economy Collapses Again » Data released last week by the U.S. government showed the U.S. economy came to a near halt in the first three months of 2015, falling to nearly zero – i.e. a mere 0.2 percent annual growth rate for the January-March quarter. The collapse was the fourth time that the U.S. economy in the past four years either came to a virtual halt or actually declined. Four times in four years it has stalled out. So what’s going on? In 2011, the U.S. economy collapsed to 0.1 percent in terms of annual growth rate. At the end of 2012, to a mere 0.2 percent initial decline. In early 2014, it actually declined by -2.2 percent. And now in 2015, it is essentially flat once again at 0.2 percent. The numbers are actually even worse, if one discounts the redefinitions of GDP that were made by the US in 2013, counting new categories as contributing to growth, like R&D spending, that for decades were not considered contributors to growth – in effect creating economic growth by statistical manipulation. Those highly questionable 2013 definitional additions to growth added around US$500 billion a year to U.S. growth estimates, or about 0.3 percent of U.S. GDP. Back those redefinitions out, and the U.S. experienced negative GDP four times in the last four years. We get -0.2 percent in 2011, 0 percent in 2012, -2.5 percent in 2014 and -0.1 percent earlier this year. It is therefore arguable that the U.S. has also experienced at least one mild ‘double dip’ recession, and perhaps two, since 2010.
Another lingering cost of the bubble: weirdly seasonal GDP data? - There’s been much gnashing of teeth in the past few weeks regarding the health of the US economy. The government’s initial estimate GDP growth in the first quarter looked weak on the surface, and private forecasters now expect downward revisions based on unfavourable changes to the trade balance. But, as we noted a few weeks ago, quarterly data are noisy, while the underlying trends are broadly positive. So it was interesting to read a new note from economists at Barclays (h/t George Pearkes) suggesting that most of the disappointment in the first quarter’s data can be explained by a statistical artifact that disproportionately affects the figures for non-oil construction, exports, and defence procurement. Ever since the start of 2010, spending in these categories has consistently collapsed in the first three months of the year only to rebound in the subsequent nine months. The difference in average annualised growth rates is a whopping 20 percentage points. Correcting for this anomaly implies that the US economy grew by 1.8 per cent (annualised rate) in the first three months of this year — almost bang-on the average of the past five years. Barclays suspects that the problem comes from the way the Bureau of Economic Analysis seasonally adjusts its data. Essentially, if you combine enough separate monthly data series that are all seasonally adjusted independently of each other, you can end up creating weird systematic patterns. This can be especially troublesome when you’re trying to deflate nominal spending data to determine real growth.
Don’t Blame Seasonal Quirks for Economy’s Winter Blues, Fed Paper Says - Federal Reserve Board economists are wading into a heated debate over whether statistical adjustments for wintry weather and other seasonal effects aren’t going far enough, making first-quarter growth look worse than it is. Their answer is a resounding no. That means forecasters can’t necessarily count on a rebound in the latter part of the year, the Fed economists say. “With a second year in a row of unusually weak first-quarter growth, some analysts have argued that there may be residual seasonality in the GDP data, that is, a predictable seasonal pattern remains in the published data,” they write in a research note. “This argument implies that there is predictable weakness in first-quarter GDP growth that will be followed by predictable strength in the subsequent three quarters of the year,” the authors add. “Our analysis here does not find convincing evidence of material residual seasonality in GDP in recent years.” The findings run counter to recent research from the Philadelphia Fed, which found economists could do a better job at making seasonal adjustments to avoid uncharacteristic winter-quarter weakness. Instead, the Fed board researchers find “no firm evidence” that the soft start to economic growth in 2015 “primarily reflects residual seasonality.”
Fed staff says first quarter slowdown was real, not a fluke of statistics - (Reuters) - Make no mistake: the U.S. economy's dismal first quarter was, in fact, a dismal first quarter, not a statistical fluke in the way U.S. gross domestic product is measured, Federal Reserve staff concluded on Thursday. The Fed staffers explored a puzzle noted recently by economists like Justin Wolfers and discussed across the business cable networks - that first quarter GDP growth seems to routinely lag the rest of the year. This happens with such frequency that it was suggested the problem may be more with how the economy is measured, particularly in the formulas for making seasonal adjustments. Economic activity ebbs and flows with some regularity through the year, such as vacation spending in the summer and holiday shopping in the fall, and accurate estimates of growth need to adjust for that. If the seasonal adjustments applied to the first quarter were biased in some way, it could cause the sort of systematic disappointment that seems to force policymakers into an annual first quarter debate over whether the sudden slowdown is temporary or likely to last. Fed officials have been scratching their heads over just that issue in recent weeks when GDP estimates for the first quarter came in near zero. Staff said they conducted a variety of statistical tests to see if something was funny about Q1 GDP estimates and they concluded that, in fact, bad weather, "statistical noise," and unspecified "idiosyncratic factors" in the economy were more likely to blame -- not an underlying data problem.
Fed Watch: Get Used To It -- As is well known, second quarter GDP growth is not off to a strong start, at least according to the Atlanta Federal Reserve staff: If this forecast holds, then the first half of 2015 will be very weak if not flat, slow enough that commentators might be tempted to refer to growth as at "stall speed". But quarterly GDP numbers are fairly volatile. Would two consecutive weak quarters be terribly unexpected, or even suggestive of a troubling undercurrent in the economy? It is somewhat difficult to panic about the GDP numbers just yet, especially in the context of the continuous slide in the forward-looking unemployment claims indicator: Moreover, should we be surprised by the occasionally GDP number in the context of lower estimate of potential growth? As Calculated Risk likes to say: Right now, due to demographics, 2% GDP growth is the new 4%. A simple way to think about this is to look at the confidence interval around the one-step ahead GDP forecast from an AR2 model: Prior to the Great Depression, it would be very unusual for the confidence interval to include a negative read on GDP outside of a recession. Following the Great Depression, however, the confidence interval around the forecast almost always captures the possibility of a negative outcome. This is likely the consequence of two factors, the downshifting of GDP growth as described by Calculated Risk and an increased GDP growth volatility in the most recent sample. Bottom Line: We probably need to get used to the occasional negative GDP growth numbers in the context of overall expansion for the US economy. The concept of "stall speed" will need to be revised accordingly.
Oops! The US economy just suffered its worst month since the Great Recession - The Wall Street Journal reports that “private forecasting firm Macroeconomic Advisers on Thursday said its monthly estimate showed GDP fell an inflation-adjusted 1% in March, the largest drop since December 2008, ‘when the U.S. economy was in the throes of recession,’ the firm said. Monthly GDP had climbed 0.3% in February and ticked up 0.1% in January after falling 0.4% in December, the firm said.” Now there is a big caveat here, according to the firm. The labor dispute at West Coast ports led to a large, but temporary, drop in exports. So the GDP number overstates any weakness in the economy. But, but, but … even with that addendum, things aren’t going gangbusters right now. First, it now looks like the economy contracted by at least a full percentage point in the first quarter. Second, second-quarter GDP estimates are also coming down. JPMorgan, for instance, yesterday cut its forecast to 2.0% from 2.5% and noted, “First half GDP growth averaging 0.5% is pretty disappointing.” Third, the WSJ’s economic survey now pegs full-year GDP growth at 2.2%, a bit slower than last year’s 2.4%. Fourth, the Fed’s Labor Market Conditions Index — Janet Yellen’s jobs dashboard — “fell into negative territory in March and April for the first time since a brief spell in 2012,” according to Goldman Sachs. So perhaps the weak growth is leaking into the labor market, though real-time indicators are more positive — for now. In any event, 2015 is shaping up as another year of stagnation rather than (finally) acceleration.
Growth Hiccups Vex Fed Yet Again - WSJ: A slew of recent soft economic data has fueled fresh expectations of dimmer U.S. growth, underscoring the already-anemic economy’s unusual vulnerability to even fleeting shocks. This softness—with output possibly flat for the first half of 2015—looks set to give Federal Reserve officials pause as they eye when to raise short-term interest rates from near zero. Fed officials see many indications of underlying strength: Companies are hiring, while incomes and wealth are rising. A variety of other indicators, though, tell a less upbeat story. The Fed on Friday reported U.S. industrial production contracted in April for the fifth straight month, down a seasonally adjusted 0.3% from the month before. A University of Michigan index of consumer sentiment also dropped. Soft April retail-sales data and dismal trade numbers, both released during the past week, had already led analysts to reduce their estimates of growth. Wall Street analysts are now marking down estimates for second-quarter growth, and many expect the first quarter to get revised down into negative territory. J.P. Morgan economists see a growth rate of just 0.5% for the first half. That backdrop points to one of the defining characteristics of this recovery: A slow-growing economy can easily be knocked off stride by even small and fleeting disturbances.
Don’t Be So Sure the Economy Will Return to Normal - It is hard to avoid the feeling that our current economic problems are more than just a cyclical downturn. We know that the economy has gone through some bad times. But what exactly are we experiencing?One relatively optimistic view is that observed deficiencies — like slow growth in real wages and the overall economy, persistently low interest rates and low levels of labor participation — are merely temporary. In this view, these problems will dwindle after manageable problems like high levels of public or household debt have been reduced.Another commonly heard view is that we made the mistake of letting the last recession linger too long, allowing some of its features to became entrenched. That analysis suggests that if we correct past policy errors, whatever they may have been, an underlying normality will re-emerge. There are some nuggets of truth in both of these arguments, but there is a much more disturbing possibility that could turn out to be more accurate: namely, that the recession was a learning experience that we haven’t fully absorbed. From this perspective, the radical and sudden changes of the financial crisis were early indicators of deep fragility and dysfunctionality. Slowly but surely, we may be responding to these difficult revelations by scaling back our ambitions for the economy — reinforcing negative trends that were already underway. In this troubling view, we have finally begun to discover some unpleasant truths. Borrowing a phrase from the University of Toronto economist Richard Florida, it’s possible that we are experiencing a “Great Reset.” Let’s consider an analogy to see how this might work in practice.
Commerce to Offer New Ways to Measure the Economy - How’s the economy doing? That depends on how you measure it. The Commerce Department this summer will add to its gross domestic product calculations with two new sets of figures on economic output. The new numbers, available June 30, should give some new insight on the economy’s behavior–and offer new fodder for economists, politicians, journalists and any other observer who wants to argue over the country’s health. The first new number will average GDP as well as what’s known as gross domestic income. Both measure overall economic activity but tap different source data–GDP uses expenditures and GDI uses incomes. While they should move in the same direction, there are often short-term discrepancies. Federal Reserve Bank of San Francisco President John Williams, in remarks earlier this week, highlighted the utility of looking at both accounts. The Philadelphia Fed already offers one such measure, which it calls GDP Plus. “After a disappointing first quarter, we should see above-trend growth for the rest of the year,” Mr. Williams said. “Further data to support this forecast can be found in a new measure of economic activity that may paint a better economic picture than GDP alone, called GDP Plus. It’s a measure that factors in both GDP and GDI, or gross domestic income, and filters out some of the noise.” The Commerce Department’s first look at GDP for the first quarter of this year clocked in at a seasonally adjusted annual rate of only 0.2%, and will likely get revised down. Mr. Williams said GDP Plus grew at an annual rate of 1.7% in the first quarter and averaged 3% growth over the past four quarters.
China Retakes Top Spot as the Biggest Foreign Owner of U.S. Debt -- It was a short-lived domination. After just a month of being the top holder of U.S. Treasury debt, Japan has once again been pushed into the No.2 slot as China bulked up on Uncle Sam’s bonds and notes. As we noted last month – and several times before that – Treasury’s data is a rough guesstimate. That makes it hard for analysts sifting through the obscure sheaves of digital data to glean anything but rough trends. It also makes it difficult to draw precise conclusions. February data published last month raised questions about whether Japan really did overtake China as the No.1 holder of American debt, as different tables revealed conflicting results. But in this month’s release of March data, released late Friday, the tables (here, here, here, here and here) all tell the same story: China is the top holder.
Report by Clinton Adviser Proposes ‘Rewriting’ Decades of Economic Policy -Hillary Rodham Clinton has not yet presented her economic agenda, but one of the economists she has turned to for advice has published an aggressive blueprint for rewriting 35 years of policies that he says have led to a vast concentration of wealth among the richest Americans and an increasingly squeezed middle class.“It’s not just a matter of redistribution,” said Joseph E. Stiglitz, a Nobel laureate in economics who has been an influential adviser to the Clinton campaign and will present his report on Tuesday. “Rewriting the rules of our market economy would reduce inequalities in market incomes.”The report, published by the Roosevelt Institute, a liberal think tank in Washington where Mr. Stiglitz is chief economist, will likely influence Mrs. Clinton’s agenda. Several proposals by Mr. Stiglitz, including raising taxes on capital gains and a push to make corporations less focused on short-term quarterly returns, are in line with what Mrs. Clinton is expected to embrace in her campaign. She has already spoken about other proposals in the report, like reforming the criminal justice system, an immigration overhaul and paid sick and family leave. But the thrust of the report, titled “Rewriting the Rules of the American Economy: An Agenda for Growth and Shared Prosperity” and scheduled to be presented at a panel discussion in Washington, is a scathing indictment of 35 years of economic policies.
Elizabeth Warren at the Roosevelt Institute (TPP and More) -- Elizabeth Warren and Rosa DeLauro recently co-authored an article posted at the Boston Globe (titled Who is writing the TPP?) which says, "Hillary Clinton has said that the United States should be advocating a level and fair playing field, not special favors for big business, in our trade deals. We agree with this blunt assessment." Some people might find it odd that Elizabeth Warren (or was it Rosa DeLauro?) would quote Hillary Clinton, who was really only quoting Elizabeth Warren. But overall, it's a great article, and it also goes on to say that "28 trade advisory committees have been intimately involved in the [TPP] negotiations. Of the 566 committee members, 480, or 85 percent, are senior corporate executives or representatives from industry lobbying groups. Many of the advisory committees are made up entirely of industry representatives."This is true, and you can see who they are in a link further below in this post. But here is where the main gripe is, that both left-wing progressives and right-wing Tea Partiers can fully agree on, when the article goes on to say:A rigged process leads to a rigged outcome. For evidence of that tilt, look at a key TPP provision: Investor-State Dispute Settlement [ISDS] where big companies get the right to challenge laws they don’t like in front of industry-friendly arbitration panels that sit outside of any court system. Those panels can force taxpayers to write huge checks to big corporations — with no appeals. Workers, environmentalists, and human rights advocates don’t get that special right.
Democrats Balk at Sparing Only Military Spending From Mandated Cuts - — Key Democrats on Thursday said they opposed Republican efforts to circumvent broad, congressionally mandated cuts in military spending as lawmakers considered the annual Pentagon budget.As the House began voting on amendments to the National Defense Authorization Act, members debated whether to dedicate about $39 billion to go into a fund insulated from the across-the-board spending cuts known as sequestration, which took effect in 2013. That fund, the Overseas Contingency Operations account, is intended to be used for emergency military operations.Representative Nancy Pelosi of California, the Democratic leader, said Republicans were willing to let nonmilitary spending bear the brunt of the cuts.“Republicans are trying to use war funding as a virtual slush fund for one part of the budget while letting the ax fall on everything else, leaving priorities essential to the strength of our country — the veterans’ budget, infrastructure, education, innovation — grievously underfunded,” she said. “The Republican defense authorization bill is not only disingenuous, it is dangerous.”Republicans responded that the military spending bill — which, at $604.2 billion in the House version, matches President Obama’s budget request, excluding the contingency fund — was not the proper vehicle for debating sequestration. Speaker John A. Boehner of Ohio slammed Democratic leaders for backing away from the legislation since it passed out of the House Armed Services Committee in a 60-to-2 vote.
House Passes Massive Defense Bill Which Obama Will Promptly Veto - The US House of Representative just approved (by a vote of 269 to 151) the $612 billion National Defense Authorization Act (NDAA) funding moar warmongery for fiscal year 2016. However, the vote came short of a veto-proof majority and since the administration opposes the defense policy bill - for its alleged budgeting "gimmicks," as well as its provisions for arming Ukrainian forces - we suspect President Obama is preparing to unleash the veto pen. As The Military Times reports, The measure includes an overhaul of the military's retirement system and rejects a host of pay and benefits trims proposed by the Pentagon. It supports, in principle, a 2.3 percent pay raise for troops, but lacks the legislative language to force that paycheck boost, leaving flexibility for President Obama to go with the lower 1.3 percent raise backed by Pentagon leaders. The bill also includes a host of new policy changes on sexual assault protections and prosecution, reforms to the defense acquisition process, and restrictions on transfer of detainees out of Naval Station Guantanamo Bay, Cuba.
Obama Moves Closer to Inking Pacific Trade Deal -- President Obama may move closer to a career-defining Pacific Rim trade deal Tuesday that could permanently alter the balance of power between the White House and Congress on trade issues. The Senate is expected to approve a bill to give the president “fast track” authority to make trade deals, reducing Congress’ role to approving or rejecting the entire deal. Members of Congress would not be allowed to filibuster a vote on a trade pact, add amendments, delete parts or otherwise tweak the final version of a trade deal. If it passes, the bill would grease the skids for Obama to finish the Trans-Pacific Partnership, an unprecedentedly massive trade pact binding the U.S. and eleven other countries, including Japan, Australia and Chile, and governing 40% of the world’s GDP. Most trade experts agree that if the fast track bill passes, it all but guarantees that the Trans-Pacific Partnership will too. Supporters of the Trans-Pacific Partnership say getting the fast track bill passed is crucial since, without it, Congress could muddle up a document that has been delicately wrought in private negotiations for nearly a decade. But critics of the deal, which includes an unlikely coalition of Tea Party Republicans and liberal Democrats, argue that passing the fast-track bill is akin to signing a blank check.
TPP: Obama’s Folly -- Barack Obama’s petulant criticism last Friday of Democrats who do not support his proposed Trans-Pacific Partnership reminds me of the old tongue-in-cheek advice to young lawyers: “If the facts are on your side, pound the facts. If the law is on your side, pound the law. If neither is on your side, pound the other lawyer.” The facts are definitely not on the president’s side. For two decades the trade deals negotiated by the last three presidents have lowered U.S. wages, lost jobs and generated a chronic trade deficit that requires our country to borrow more money every year in order to pay for imports. The president’s main argument that exports have risen, without mentioning that imports have risen much faster, is now transparently deceitful to anyone who can add and subtract. Neither is the law in his corner. As did his predecessors, Bill Clinton and George Bush, he assures Americans that this deal will be different because, you see, it will protect workers. But the secret draft, which had to be revealed to Americans by Wikileaks, shows that once again a trade agreement will be used to enhance the power of multinational corporate investors over people who have to work for a living. As AFL-CIO President Richard Trumka pointed out recently, the Office of the U.S. Trade Representative, which is charged with negotiating and enforcing the deal, does not even believe that murder and other brutal acts committed against labor union activists violate the “worker-protection” clauses to trade agreements.So, like a lawyer trained to defend the indefensible, Obama is desperately pounding the opposition. They are “just wrong,” he says, without showing us why. He accuses them of “making stuff up”—that is, that they are liars. He whines that they are “whupping on me.” He charges, nonsensically, that they “want to pull up the drawbridge and isolate themselves.”
Elizabeth Warren fires back at Obama: Here’s what they’re really fighting about - In an interview with Yahoo News that ran over the weekend, President Obama intensified his push-back against Elizabeth Warren and other critics of the massive Trans-Pacific Partnership trade deal, flatly declaring that Warren is “absolutely wrong.” That came after a speech Obama delivered at Nike headquarters, in which he continued making an expansive case for the deal as a plus for American workers — and not the massive giveaway to huge international corporations that critics fear. This week, the Senate will vote on whether to grant Obama “fast track” authority to negotiate the TPP agreement, which involves a dozen countries around the Pacific and could impact 40 percent of U.S. trade. If the “fast track” framework passes, Congress would hold only an up-or-down vote on the TPP once it is finalized, without amendments. But Congress could also repeal that fast track authority if the TPP is not to its liking, and try to push changes to it, before any final vote. Warren has previously claimed that the TPP’s controversial Investor-State Dispute Settlement provision, or ISDS, could undermine or chill public interest regulations in the U.S. and other participating countries, and could even undercut Dodd Frank financial reform, one of Obama’s signature achievements. The ISDS is designed to create a neutral international arbitration mechanism that creates a stable legal environment, facilitating investments in countries where investors might fear unfair legal treatment by foreign governments. Obama has strongly rejected Warren’s arguments in the interview with Yahoo and elsewhere. I spoke to Senator Warren about their disagreements. A lightly edited and condensed transcript follows.
5 Leading Legal Scholars on TPP: We Write Out of Grave Concern --We write out of grave concern about a document we have not been able to see. Although it has not been made available publicly, we understand that the Trans-Pacific Partnership (TPP) trade agreement currently being negotiated includes Investor-State Dispute Settlement (ISDS) provisions. ISDS allows foreign investors—and only foreign investors—to avoid the courts and instead to argue to a special, private tribunal that they believe certain government actions diminish the value of their investments. Courts are central institutions in the rule of law. Americans have much to be proud of in the evolution of our court system, which has evolved over the centuries and now provides equal access for all persons. Courts enable the public to observe the processes of development of law and to watch impartial and accountable decision-makers render judgments. We write because of our concern that what we know about ISDS does not match what courts can provide. Those advocating using this alternative in lieu of our court system bear the burden of demonstrating why such an exit is necessary, and how the alternate system will safeguard the ideals enshrined in our courts. Thus far, the proponents of ISDS have failed to meet that burden. Therefore, before any ISDS provisions are included in the TPP or any future agreements, including the Transatlantic Trade and Investment Partnership (TTIP), their content should be disclosed and their purposes vetted in public so that debate can be had about whether and if such provisions should be part of proposed treaties. Below, we detail the ways in which ISDS departs from the justice opportunities that U.S. courts provide.
Guest Contribution: “New Improved Trade Agreements” - Trade is now high on the agenda in Washington. President Obama is pushing hard for Congress to give him Trade Promotion Authority (TPA), once known as fast-track, which he intends to use to complete negotiations with 11 trading partners under the Trans Pacific Partnership. Without TPA, trading partners hold back from offering their best concessions to the president’s trade representative, fearing correctly that Congress would seek to take “another bite of the apple” when the White House brought the agreement to them for ratification. Foreign Affairs magazine last month surveyed 24 experts (“experts”?), asking “Should Congress Pass Trade Promotion Authority?” In short, 21 of us said yes, 3 said no. It gives our names and short explanations. In marketing the Trans Pacific Partnership (TPP), the President emphasizes some of the features that distinguish it from earlier free trade agreements such as NAFTA. They include commitments by Pacific countries on the environment and expansion of enforceable labor rights. They also include the geopolitical argument for the much-discussed “pivot to Asia.” (Detractors, for their part, focus on some new features as well, such as investor protection, which is said to benefit only big corporations.) The White House political strategy is understandable. As with commercial products, the slogan “New and Improved!” sells. Previous trade agreements are not very popular. This is especially true of NAFTA. Furthermore, longstanding concerns about trade are probably now exacerbated by a deterioration of the trade balance this year. President Obama’s argument is apparently, “Yes, the earlier agreements fell short in many ways. But we have learned from the mistakes and this one will fix them.” The truth, however, is that the previous agreements did benefit the US, as well as partners. The most straightforward argument for TPP is that similar economic benefits are likely to follow.
Stupid Trade Gets Dangerous: TPP Threatens US Military Supply Chain - The White House claims that Obama's Trans-Pacific Partnership would help counter China's growing economic and military threat. Many Republicans, including nominal pro-defense patriots, are curiously supportive of the President in this case. Ironically bipartisan trade policy created our China problem in the first place and this latest love fest demonstrates a shocking lack of appreciation for a primary source of American military strength, productive capacity. America has stubbornly pursued trade agreements without any regard to strategic industrial policy. Regardless of the party in the White House we've maintained a truly gullible approach to the rough-and-tumble of real-world global commerce. That has earned us little besides a half-century of growing net losses. The countries beating us worst are the ones with actual industrial strategies: Germany, Japan, South Korea and China. Today we are now bleeding 4 percent of GDP annually. To cover those we've sold our assets and accumulated a debt unknown in human history. During this period, our competitors have maintained a laser like focus on capturing U.S. manufacturing jobs and while the free trade pundits are quick to dismiss manufacturing as irrelevant, the resulting erosion of America's industrial base has serious strategic implications. Maintaining military production in a "service economy" is simply farcical. Sophisticated systems require healthy and diversified supply chains. The efficient production of specialized, low volume products, like military aircraft, depends on supporting industries that provide a sustained demand for subcomponents, services and factors of production. A nation efficiently producing jets and submarines must also have domestic demand for steel, aluminum, carbon fiber, precision machined parts, hydraulics and electronics. Production of these materials at a sustainable level depends on markets in things like aircraft, autos, boats and consumer electronics.
Put Trade on the Right Track — Not the Fast Track -Time is growing short in a heated debate over the Obama Administration's ambitious new trade deals. As early as this Thursday, the Senate will vote on granting the President's request for "trade promotion authority" or what is more commonly known as "fast track." The bill before the Senate is procedural: it will provide for the fast tracking of the "Trans-Pacific Partnership" (TPP) negotiated with eleven other Pacific Rim countries and a trade and investment agreement with the European Union (TTIP) expected later this year. Fast track provides for an up or down Congressional vote on the drafts that the President's negotiators bring forward, without the possibility of further amendments by Congress. Getting fast track out of the Senate has been harder than the President expected, with Senators Elizabeth Warren, Bernie Sanders, Sherrod Brown and most progressive Democrats opposing the Pacific deal, which they say would undercut American labor, environmental protection and democratic government. The President has shot back with heated criticism of his opponents, assuring the public that the TPP is the "most progressive trade agreement in our history." But it is hard for outsiders to verify the President's claim, since the draft of the Trans-Pacific Partnership remains classified under a national security provision and is thus unavailable for public scrutiny. In fact, members of Congress can only see the draft trade agreement in a secure basement room, after leaving cell phones at the door. Those who have seen the text are later allowed to provide only broad descriptions of what it contains. While the draft TPP may be viewed by those with security clearance, the European negotiations are at a less advanced stage, and no draft of the TTIP is yet available to Congress. But the fast track authority being decided this week would authorize the same up or down Congressional vote on whatever the President's team eventually delivers. In fact, if Congress approves fast track, the grant will last for six years, guaranteeing this Administration--and the next--a chance to push forward the TPP, the TTIP, and any future trade agreements.
Fast Track Authority for Toxic Trade Fails Key Vote in Senate -- Yves Smith - The Senate gave Obama a decisive defeat by refusing to let fast track authority for the TPP and other pending trade deals advance to the stage of being debated. Thanks to all of your calls, e-mails and letters to Senators, Representatives, and local media. This is one of those rare cases where the process worked. From Reuters: Legislation giving U.S. President Barack Obama authority to speed trade deals through Congress failed a crucial procedural test on Tuesday, delaying a measure that may be key to President Barack Obama’s diplomatic pivot to Asia. In a setback to the White House trade agenda, the Senate voted 52-45 – eight votes short of the necessary 60 – to clear the way for debate on the legislation, which would allow a quick decision on granting the president so-called fast track authority to move trade deals quickly through Congress. The vote marked a big victory for Senate Democratic leader Harry Reid, an outspoken opponent of fast-track. The failure to garner the necessary votes came after key pro-trade Democrats, including Senator Ron Wyden of Oregon, announced they would vote no on the procedural vote because the measure lacked some trade protections. Bloomberg bizarrely has the heading for its Fast Track article, on its main page, in red, “Last Minute Rebellion”. Anyone who has been paying attention knows that most Democrat Congressmen opposed the deal; Obama has been trying to win over enough to give Republicans air cover so that they can claim these traitorous deals are “bipartisan”. From the story:Senate Democrats staged a last-minute rebellion against one of President Barack Obama’s top legislative priorities by blocking a test vote on a trade measure that didn’t include companion measures they sought. The vote, 52-45, effectively delays fast-track legislation Obama wants to expedite approval of trade accords. Supporters needed 60 votes to advance the bill to a final vote.
Senate Democrats Defeat The President: Why Obama Is Rushing To Fast-Track The TPP - Moments ago, in an embarrassing setback for the president, Senate Democrats in a 52-45 vote - short of the required 60 supporters - blocked a bill that would give President Barack Obama fast-track authority to expedite trade agreements through Congress, a major defeat for Obama and his allies who "say the measure is necessary to complete a 12-nation Pacific trade deal that is a centerpiece of the administration’s economic agenda." The passage failed after a leading pro-trade Democrat said he would oppose the bill: Ron Wyden, the top Democrat on the Senate Finance Committee, said he would vote no and his loss was a major blow to hopes of attracting a sufficient number Democrats to get 60 "yes" votes in the chamber. According to Reuters, the Senate vote was one of a series of obstacles to be overcome that hinged on the support of a handful of Democrats. The White House has launched a campaign blitz directed at them in support of granting the president authority to speed trade deals through Congress. Fast-track legislation gives lawmakers the right to set negotiating objectives but restricts them to a yes-or-no vote on trade deals such as the TPP, a potential legacy-defining achievement for Obama. Senate Majority Leader Mitch McConnell, hoping to shore up support, reminded his fellow senators that Tuesday's vote simply would pave the way for debating fast-track legislation. The WSJ cites Mitch McConnell who told reporters shortly before the vote, which he expected to lose, that “This issue’s not over" adding that "I’m hopeful we’ll put this in the win column for the country sometime soon.”
Fast-Track Authority Fails: Is TPP a Goner? - While trade has been a moribund topic Stateside for quite a long time, the US Congress voting on whether to grant President Obama fast-track authority--or that which enables him to secure trade deals like the Trans-Pacific Partnership currently being negotiated and have them voted on a yea/nay basis instead of being amended or filibustered--was bound to generate some interest. Unfortunately for Obama, he has just failed to secure the 60 votes needed in the Senate. With fast-track authority stalled, is the TPP too? (The House votes on fast-track authority soon as well.) Senate Democrats on Tuesday blocked a bill that would give President Barack Obama fast-track authority to expedite trade agreements through Congress, a major defeat for the president and his allies who say the measure is necessary to complete a 12-nation Pacific trade deal that is a centerpiece of the administration’s economic agenda.The vote was 52-45, with supporters short of the 60 votes necessary to clear a procedural hurdle to advance the bill. The Senate action almost certainly won’t be the last word on the issue. Most observers believe a majority of senators support the fast-track measure as well as the Trans-Pacific Partnership, the big trade deal whose path would be smoothed by fast-track. But the procedural setback means Senate Majority Leader Mitch McConnell (R., Ky.) must regroup in an effort to assemble the support necessary to advance the measure past the chamber’s 60-vote threshold. Who voted against fast-track authority? Mostly Democrats--for the most part anti-trade--and more so nowadays after years and years of moribund incomes in the US which they usually blame on trade liberalization. Senate Democrats asked fast-track authority to be bundled with all sorts of other things like retraining for those who lose their jobs due to trade liberalization and the ever-popular currency manipulation chestnut. In the absence of most of these, well, they just turned their own president down:
Senate Democrats Throw Obama Under the Bus: Fast Track Trade Bill Stalls; Right For Wrong Reasons -- In rare political reverse alignment, Senate republicans voted for Obama's Fast Track proposal while Sen. Tom Carper, D-Del., was the only Democrat to vote with Republicans. To proceed, the bill needed a super-majority of 60 votes. In a vote likely to shock president Obama, Fast Track Failed 52-45 Senate Republicans have been working with the Obama administration to reauthorize fast track negotiating authority aimed at assisting Obama in finalizing a trade pact with 11 Asia-Pacific nations. Fast track authority authorizes the president to submit to Congress negotiated trade deals that can only be approved or rejected, not amended, on an expedited basis. The Senate Finance Committee approved the bill, 20-6, in a bipartisan vote last month. Chairman Orrin Hatch, R-Utah, and Senate GOP leaders believed they had reached an agreement with the panel's top Democrat, Sen. Ron Wyden, D-Ore., to begin debate this week on the fast track legislation, with assurances that it would move in tandem with a trade adjustment assistance package to aid American workers negatively affected by trade deals. However, Democrats en masse demanded Tuesday that Republicans include in the deal two additional, committee-approved bills: a non-controversial measure supporting African economies and a customs enforcement measure that includes controversial language aimed at cracking down on China for currency manipulation.Wyden announced Democrats could not move forward unless there was assurances that "all four of the measures I've described are actually enacted." Republicans balked. "What I'm not going to put up with is the minority trying to craft a bill before we even get on it. That's just simply unacceptable," said Senate Majority Leader Mitch McConnell, R-Ky.
Obama’s Trade Backfire - WSJ: The trade bill failed a major procedural vote on Tuesday, with every Senate Democrat save one blocking debate on what President Obama continues to call an economic priority. The 52-45 liberal blockade doesn’t mean trade-promotion authority is dead. But preventing a setback from becoming a rout will require a Republican salvage operation to rescue Mr. Obama from the consequences of his governing methods. The politics of trade require Presidents to cultivate coalitions from the center out, building a majority between statist progressives and the protectionist right. But that is not Mr. Obama’s thing. His instincts are to govern from the left, treat Members of Congress as peasants who must bow before his superior wisdom, and then assail the motives and character of his opponents. Mr. Obama’s attack-and-polarize approach worked while he had overwhelming liberal majorities, despite private unrest among Democrats about the White House’s ex-cathedra habits. They didn’t mind when he attacked Republicans as moral cretins and dissemblers. The difference is that on trade Mr. Obama has turned his contempt on Democrats. At the Nike campus in Oregon over the weekend, Mr. Obama berated “my fellow-travellers on minimum wage and on job training and on clean energy. . . . And then on this one, they’re like whooping on me.” He added that these critics are “just wrong” and “they’re making this stuff up.”
Senate Reaches Deal To Vote Thursday On 'Fast-Track' Trade Bill -- One day after Senate Democrats blocked the "fast-track" trade authority bill that has been championed by both President Obama and Republicans, Majority Leader Mitch McConnell says an agreement has been reached to move forward.The solution calls for separate votes on bills that Democrats had wanted to move as a single package on the floor, according to NPR's Ailsa Chang. Ailsa says the Senate will vote on a customs enforcement bill that includes Sen. Charles Schumer's safeguards aimed at reducing currency manipulation.The customs bill "will get a vote tomorrow at 10:30 a.m.," Ailsa reports, along with "a vote on a bill giving trade preference to sub-Saharan African countries."Votes on final passage of those two measures is slated for 12:30 p.m. ET.The deal comes a day after the "fast track" bill that would give the president TPA — or trade promotion authority — fell eight votes short of the 60 needed to avoid a Senate filibuster. As Brian Naylor reported for The Two-Way on Tuesday, the trade authority "would ultimately clear the way for passage of the Trans Pacific Partnership — a complex trade agreement that its supporters say will provide new markets for American goods as well as new jobs."
After Lobbying by Obama, Senate Agrees to Vote on Trade Bill After All - Senate leaders, after personal intercessions by President Obama, reached an agreement Wednesday on a path to grant the president accelerated power to complete a sweeping trade accord ringing the Pacific Ocean — just a day after fellow Democrats had blocked him.The larger aim is to secure a 12-nation agreement known as the Trans-Pacific Partnership, spanning the Pacific from Canada and Chile to Japan and Australia and encompassing 40 percent of the world’s economic output. Mr. Obama sees the pact as a central part of his economic legacy, the largest trade deal in two decades and the realization of his foreign policy pivot toward Asia.It also means money. Major American business interests, from Nike to Boeing and Hollywood to Silicon Valley, want the deal badly. Labor and environmental groups see it as a threat to American workers at the expense of profits.A series of trade-related votes will begin Thursday and stretch well into next week. The trade promotion authority would give the president the ability to move more quickly on the deal, leaving Congress with the power to vote up or down on the agreement but with no ability to amend it. While the pathway to passage became clearer Wednesday, it is still treacherous. Most Senate Democrats will ultimately oppose the trade promotion bill, and with the stated opposition of Senators Rand Paul of Kentucky and Jeff Sessions of Alabama, both Republicans, there are now louder rumblings on the president’s right flank. “Now is not the time to celebrate,” said Senator Orrin Hatch of Utah, the Finance Committee chairman. “While this agreement solves a temporary procedural issue, now is when the real work begins.”
Fast Track will empower GOP president, McConnell says - Yesterday, Senate Democrats blocked the bill that would have given President Obama “fast track” authority to negotiate trade deals, subject only to a Congressional up-or-down vote later. Though this battle is far from over, this raises the possibility that Democratic opponents of the Trans-Pacific Partnership could ultimately succeed in derailing it by scuttling the Fast Track process itself.Now opponents of Fast Track may have inadvertently been given some new ammunition by an unlikely source: Staunch TPP-advocate Mitch McConnell. In an interview with John Harwood, McConnell said that Republicans should support Fast Track authority, explicitly because — and here’s the rub — it will empower the next GOP president to negotiate trade deals more easily, despite Democratic opposition to them in Congress:“If we had a Republican president right now, not a single Democrat would vote for Trade Promotion Authority. So what I’ve said to my members, if we want the next Republican president, who we hope will be sworn in less than two years from now, to have a chance to do trade agreements with the rest of the world, this bill is about that president as well as this one.” McConnell added, by way of illustration, that Fast Track is a “six year bill.” Expect Democratic opponents of Fast Track to grab on to this. It dovetails nicely with the argument they are making: That Fast Track could ultimately undermine achievements like the Dodd Frank financial reform bill.
Senate Passes Obama's TPP Fast-Track Trade Proposal -- Two days ago there was some rejoicing and much surprise when the "Warren-faction" of Senate liberals turned against Obama, and failed to vote for a fast-track approval of the TPP. That surprise lasted for about 48 hours when moments ago, in a 65-33 vote, the Senate finally advanced a measure allowing Obama to expedite approval of trade agreements, a bill with bipartisan support in that chamber which however according to Bloomberg may run into strong opposition from House Democrats. The vote followed separate votes sought by Democrats to pass proposals curbing currency manipulation and boosting imports from sub-Saharan Africa. The Senate plans to consider amendments to the fast-track trade proposal next week. As previously reported, a rebellion Tuesday among Senate Democrats seeking the currency provision previews what may be fiercer battle ahead between Democrats and House Speaker John Boehner, an Ohio Republican. “There’s a broad feeling we have to do something against China” on currency manipulation, New York Senator Charles Schumer, the chamber’s third-ranking Democrat, told reporters before the vote on advancing the trade bill. He called the currency measure “a shot across China’s bow that we’re not going to just sit there and do nothing.”
Influence peddlers seem to know more about the Trans-Pacific Partnership than Congress - The restrictions the Obama administration has placed on members of Congress wishing to peruse the text of the Trans-Pacific Partnership, a managed trade agreement among the United States and 11 other countries, are something of a shock in a democratic republic. Lawmakers can bring staff, but only those with the necessary security clearances. They can take notes, but must surrender them to the guards upon leaving. They may not bring in electronic devices such as cameras or cellphones that could be used to copy passages of the bill. As Sen. Barbara Boxer, D-Calif., pointed out in an impassioned floor speech attacking the restrictions, the document is not a matter of national security, but rather regulates commercial transactions among nations. The administration made the text available to Congress under the aforementioned restrictions in a bid to win its support for fast track trade authority, allowing the president to negotiate the deal and then submit it to Congress for an up-or-down vote, with no amendments. The extreme secrecy of the text hasn’t stopped interest groups from lobbying in its favor, though. The U.S. Chamber of Commerce is pushing the agreement, quoting studies on the unread document that project it will lead to a $124 billion surge in U.S. exports by 2025. A review of first quarter lobbying filings shows 134 corporations, 78 trade associations and 13 labor unions lobbying on the bill. The interests pushing the pact include industry groups like the Pharmaceutical Manufacturers and Research of America and the American Apparel and Footwear Association, corporations like Caterpillar and Coca-Cola, agricultural groups like the National Cattlemen’s Beef Association, the National Milk Producers Federation and the National Chicken Council, and the Emergency Committee for American Trade (ECAT).
The Secret Corporate Takeover -- Joseph Stiglitz --- The United States and the world are engaged in a great debate about new trade agreements. Such pacts used to be called “free-trade agreements”; in fact, they were managed trade agreements, tailored to corporate interests, largely in the US and the European Union. Today, such deals are more often referred to as “partnerships,”as in the Trans-Pacific Partnership (TPP). But they are not partnerships of equals: the US effectively dictates the terms. Fortunately, America’s “partners” are becoming increasingly resistant. It is not hard to see why. These agreements go well beyond trade, governing investment and intellectual property as well, imposing fundamental changes to countries’ legal, judicial, and regulatory frameworks, without input or accountability through democratic institutions. Perhaps the most invidious – and most dishonest – part of such agreements concerns investor protection. Of course, investors have to be protected against the risk that rogue governments will seize their property. But that is not what these provisions are about. There have been very few expropriations in recent decades, and investors who want to protect themselves can buy insurance from the Multilateral Investment Guarantee Agency, a World Bank affiliate (the US and other governments provide similar insurance). Nonetheless, the US is demanding such provisions in the TPP, even though many of its “partners” have property protections and judicial systems that are as good as its own. The real intent of these provisions is to impede health, environmental, safety, and, yes, even financial regulations meant to protect America’s own economy and citizens. Companies can sue governments for full compensation for any reduction in their future expected profits resulting from regulatory changes.
Sovereignty For International Investors (Trans-Pacific Partnership (TPP)) -- Elizabeth Warren makes a compelling case against the Trans-Pacific Partnership in The Trans-Pacific Partnership clause everyone should oppose, where she says: ISDS [Investor-State Dispute Settlement] would allow foreign companies to challenge U.S. laws — and potentially to pick up huge payouts from taxpayers — without ever stepping foot in a U.S. court. Here’s how it would work. Imagine that the United States bans a toxic chemical that is often added to gasoline because of its health and environmental consequences. If a foreign company that makes the toxic chemical opposes the law, it would normally have to challenge it in a U.S. court. But with ISDS, the company could skip the U.S. courts and go before an international panel of arbitrators. If the company won, the ruling couldn’t be challenged in U.S. courts, and the arbitration panel could require American taxpayers to cough up millions — and even billions — of dollars in damages. If that seems shocking, buckle your seat belt. ISDS could lead to gigantic fines, but it wouldn’t employ independent judges. Instead, highly paid corporate lawyers would go back and forth between representing corporations one day and sitting in judgment the next. Maybe that makes sense in an arbitration between two corporations, but not in cases between corporations and governments. If you’re a lawyer looking to maintain or attract high-paying corporate clients, how likely are you to rule against those corporations when it’s your turn in the judge’s seat?… I understand Senator Warren’s focus on the United States, but it diverts her from a darker issue raised by the TPP. The TPP gives international investors sovereignty equivalent to national governments.
Will the TransPacific Partnership Agreement Go into the Deep Freeze? - naked capitalism - Yves here. It’s been discouraging to see a significant portion of members of the commentariat take a “These awful trade deals are inevitable, lie back and think of England” attitude as far as fighting the trade deals are concerned, and are unwilling to make even the small investment of time required to call their Senators and Representative to put their opposition on record. The battle is going far better than the opposition expected. Obama had planned to have Fast Track authority sail through the Senate so as to prove to the House, where he faces a real fight, that the bill has bipartisan support, Majority Leader John Boehner has made clear that he is not going to pass a bill without having meaningful Democratic party air cover, and he hasn’t seen enough evidence of that in whip counts. The fact that Obama got a visible black eye in the Senate and has lost time in moving the bill forward has strengthened the position of opponents and called more public attention to the process. It also has underminded Obama’s plan to make approval of Fast Track authority seem uncontroversial and inevitable. This post explains why merely delaying Obama so that he does not get the bill passed in May throws a likely fatal wrench into the entire deal. The Administration is already about as late as it can be in getting the deal done, given the moving parts overseas and the President moving into lame duck territory. One thing the author gets wrong is when Congress goes out of session. The last day for business this month for the House is this Thursday, the 21st, and for the Senate, Friday the 22nd. So your calls are critical to stiffening the spine of the rebels and letting the traitors know that voters will take their vengeance for a sellout in the next election
The U.S. Corporate Tax Isn’t That Weird - NYTimes.com: We wouldn’t want to follow North Korea’s lead on tax policy. But what about South Korea?In a speech on Tuesday in New Hampshire, Chris Christie, New Jersey’s governor and a possible presidential candidate, used a comparison to North Korea to attack the United States’ system of worldwide corporate taxation. The federal government subjects American companies to American taxes (at least in theory) on their entire global profits.“As it stands now America is among a tiny handful of nations, including North Korea, that has a system that taxes profits twice,” Mr. Christie said. “None of our largest trading partners do this. None of them. They all have a territorial system like the one I’m suggesting.”Mr. Christie was wrong. In fact, two of our largest trading partners (Mexico and South Korea) also levy worldwide corporate income taxes. So do three other members of the Organization for Economic Cooperation and Development: Israel, Ireland and Chile.Mr. Christie is right that worldwide taxation isn’t the norm: 28 of 36 countries in the O.E.C.D. use a “territorial” system of the sort he favors, in which companies are (again, at least in theory) taxed only on profits actually earned in the country. But the two kinds of systems coexist because they aren’t as different as they sound. In practice, corporate tax systems are almost always hybrids: worldwide with some territoriality thrown in, or territorial with worldwide characteristics.
About this: 5 US companies — Apple, Microsoft, Google, Pfizer, and Cisco — are sitting on $439 billion in overseas cash -- The FT reports that just “five US companies are hoarding nearly half a trillion dollars as the country’s tax code and a tepid global economy deter businesses from spending their overseas cash piles. Apple, Microsoft, Google, Pfizer and Cisco are sitting on $439bn of cash — accounting for more than a quarter of the total $1.73tn being held by US groups, according to Moody’s Investor Services. The top 50 together hold almost $1.1tn, with the iPhone maker alone accounting for more than a 10th of the cash reserves.” Ding, ding, ding. Yet another reason for tax reform to bring some of that dough home — for investment, for dividends, buybacks, to pay for needed public investment. Along the same lines, a WSJ commentary by Thomas Duesterberg and Donald Norman note the “chronic weakness” in US capital investment. In 2014, real GDP was 9% above prerecession levels vs. 4% for gross private invesment. And private investment net of depreciation $524 billion in 2013 versus $860 billion in 2006. Duesterberg and Norman think link weak capital investment to the continuing productivity slowdown — growing just 1.5% annually between 2005 and 2014. Why is behind this trend? They point to the high US corporate tax rate but also the growing regulatory burden: Also recall that a big part of the secular stagnation argument, at least as put forward by economist Larry Summers, is that there’s both a paucity of high-return investments for business and too little demand to prompt action. As I wrote earlier this year: “Weaker-than-expected investment this year would give weight to the sec-stag thesis, while a business spending spree would ague the opposite.”
Fifteen years of hurt: Tech stocks were a bubble in 2000 but they are not this time—yet - Economist -- STOCKS are the best investment for the long run. That is the common mantra among investment pundits. But the recent record high for the NASDAQ, America’s tech-heavy equity index, ought to give investors pause. Like the FTSE 100 in London, it has taken 15 years for the NASDAQ to surpass its previous high (see chart). Even so, that counts as a sprightly performance compared with Japan’s Nikkei 225, which still trades at only half its 1989 peak. Such statistics make it hard to argue that “there are no such things as bubbles”, as the occasional economist still contends. A very high stockmarket valuation implies the expectation of rapid growth in future profits. The average price-earnings ratio of the NASDAQ back in 2000 was more than 150. In other words, if profits did not rise, a shareholder would have had to wait for well over a century to recoup his original investment.
Mr. Market Says Dodd-Frank Isn’t Working --naked capitalism -- Yves here. While I am not convinced that breaking up big banks solves the “too big to fail” problem. Hedge fund LTCM nearly brought down the financial system in 1998. The comparatively small and simple by modern standards #4 bank in 1984, Continental Illinois, took seven years to resolve. Nevertheless, it would be a big step in the right direction. One of the advantages isn’t just reducing the size of firms but increasing their diversity. Andrew Haldane of the Bank of England warned that one of the big sources of instability in our modern financial system is a monoculture, in which the biggest firms are pursuing virtually identical strategies and using similar risk models (not just VaR, but FICO in their retail businesses) and trading approaches. Similarly, having more specialized players also means more contested regulatory demands as players with different customers and products jockey for regulatory advantage.
Elizabeth Warren’s Trade Deal Fears Confirmed: Canada Uses NAFTA to Challenge Volcker Rule - Yves Smith - In her attacks on Obama’s pending trade deals, Elizabeth Warren has argued that could undermine US financial regulations like Dodd Frank. The Administration has taken to trying to dismiss Warren as not knowing what she was talking about. More skillful defenders of the traitorous trade deals took the tact of saying that Warren could in theory be right, but the odds of her fears playing out were so remote as to not be worth worrying about. In a long, careful article in the Nation yesterday, George Zornick explains even with the limited information that we have now about the contents of proposed treaties like the TPP and its ugly European step-sister, the TTIP, Warren’s worries are valid. An example of Warren’s concerns came out of left field yesterday, as reported by the Wall Street Journal: A U.S. rule that prohibits banks from taking risky bets with their own money violates the North American Free-Trade Agreement because it bans U.S. banks from trading triple-A-rated Canadian government debt, Canada’s finance minister said Wednesday… Canadian concerns about the Volcker rule’s treatment of sovereign debt aren’t new. In 2012, Canada joined European countries and Japan in raising concerns about the law’s reach.. Mr. [Joe] Oliver noted that the Volcker rule reflects concerns about the credit standing of some foreign securities. That concern doesn’t apply to Canada, he said, because Canada’s credit rating is better than the U.S. government and U.S. municipalities…“I believe—with strong legal basis—that this rule violates the terms of the Nafta agreement,” Mr. Oliver told a securities industry audience in New York that included the U.S. ambassador to Canada, Bruce Heyman. “I hope the United States administration sees that changing the Volcker rule is in its own best interests and that of its biggest trading partner.”
Global Bond Rout: What's Really Behind It: In the past three weeks, yields have spiked on sovereign debt which has caused an estimated loss of over $400 billion globally – and counting. (Bond prices move inversely to interest rates.) This has effectively been a rapid, unanticipated tightening of monetary policy by the markets themselves – leaving central banks in Europe, China and Japan, which are trying to effectuate an easing of rates, nervously fingering their worry beads. The business media has attributed the spike in rates to everything from the rise in oil prices refocusing attention on the potential for inflation, rather than deflation, to the unwinding of crowded trades as investors prepare for a Fed rate hike. Those factors may be at play to some degree, but the real worry here is one of supply and demand – now and going forward. What most American citizens don’t know is that in the U.S., global banks that are designated as primary dealers are contractually required to participate in all Treasury auctions. According to the Government Accountability Office (GAO), the primary dealers “buy the largest share of Treasury securities at auction.” There are currently 22 primary dealers, global banks like Citigroup, JPMorgan, Goldman Sachs, Morgan Stanley, UBS and Deutsche Bank that also make big bets globally on sovereign debt. When banks have to bid in a $64 billion auction in the U.S., they tend to lighten their exposure to notes and bonds elsewhere. But there is more on the minds of global bond investors than big quarterly Treasury refundings in the U.S. There is a growing concern that the extreme levels of wealth and income inequality here and abroad are creating a permanent, rather than temporary, rate of tepid economic growth worldwide. This translates into a future where governments are forced to issue ever more debt to plow into fiscal spending to prevent their economies from lapsing into deflation and, potentially, a depression.
Wall Street Vampires, by Paul Krugman - Last year the vampires of finance bought themselves a Congress. And the Republicans who came to power this year are returning the favor by trying to kill Dodd-Frank, the financial reform enacted in 2010. And why must Dodd-Frank die? Because it’s working. ... For one thing, the Consumer Financial Protection Bureau — the brainchild of Senator Elizabeth Warren — is, by all accounts, having a major chilling effect on abusive lending practices. And early indications are that enhanced regulation of financial derivatives — which played a major role in the 2008 crisis — is having similar effects, increasing transparency and reducing the profits of middlemen. What about the problem of ... “too big to fail”? There, too, Dodd-Frank seems to be yielding real results, in fact, more than many supporters expected. ... All of this seems to be working: “Shadow banking,” which created bank-type risks while evading bank-type regulation, is in retreat. ... But the vampires are fighting back. O.K., why do I call them that? Not because they drain the economy of its lifeblood, although they do: there’s a lot of evidence that oversize, overpaid financial industries — like ours — hurt economic growth and stability. Even the International Monetary Fund agrees.But what really makes the word apt in this context is that the enemies of reform can’t withstand sunlight. Open defenses of Wall Street’s right to go back to its old ways are hard to find. When right-wing think tanks do try to claim that regulation is a bad thing that will hurt the economy, their hearts don’t seem to be in it. ...
'Social Costs of the Financial Sector' - Via Tim Taylor, a quotation from Luigi Zingales ("watch video of the lecture or read the talk at his website"): While there is no doubt that a developed economy needs a sophisticated financial sector, at the current state of knowledge there is no theoretical reason or empirical evidence to support the notion that all the growth of the financial sector in the last forty years has been beneficial to society. In fact, we have both theoretical reasons and empirical evidence to claim that a component has been pure rent seeking. ... There is a large body of evidence documenting that on average a bigger banking sector (often measured as the ratio of private credit to GDP) is correlated with higher growth, both cross-sectionally and over time. ... [I]in this large body there is precious little evidence that shows the positive role of other forms of financial development, particularly important in the United States: equity market, junk bond market, option and future markets, interest rate swaps, etc. ... If anything, the empirical evidence suggests that the credit expansion in the United States was excessive. The problem is even more severe for other parts of the financial system. There is remarkably little evidence that the existence or the size of an equity market matters for growth. ... I am not aware of any evidence that the creation and growth of the junk bond market, the option and futures market, or the development of over-the-counter derivatives are positively correlated with economic growth. ... Reminds me of this graph from the IMF blog:
Big banks flag dangers of financial bubble in oil and commodities - The big global banks have begun to warn clients that the blistering rally in oil and industrial commodities in recent weeks has run far ahead of economic reality, raising the risk of a fresh slump in prices over the summer. Barclays, Morgan Stanley and Deutsche Bank have all issued reports advising investors to tread carefully as energy and base metals fall prey to unstable speculative flows in the derivatives markets. Oil has jumped 40pc since January even as the US, China and the world economy as a whole have been sputtering, falling far short of expectations. “Watch out: this rally may not last. The risks for a reversal in recent commodity price trends are growing,” said analysts at Barclays. “There is a huge disconnect between the price action in physical markets where differentials are signalling over-supply and the futures markets where all looks rosy.” Miswin Mahesh, the bank’s oil strategist, said a glut of excess oil is emerging in the mid-Atlantic, with inventories rising at a rate of 1m barrels a day (b/d). Angola and Nigeria are sitting on 80m barrels of unsold crude and excess cargoes are building up in the North Sea and the Mediterranean. Morgan Stanley echoed the concerns, warning that speculators and financial investors have taken out a record number of “long” positions on Brent crude on the futures markets even though the world economy keeps falling short of expectations. “We have growing concerns about crude fundamentals in the second half of 2015 and 2016,” it said.
Rise of the Trader-Bots - The New Yorker: Five years ago, on the afternoon of May 6, 2010, the Dow and the S. & P. fell more than six per cent in a matter of minutes, losing a trillion dollars in value. The “flash crash,” as it came to be known, terrified investors: it was huge, it was fast, and it made absolutely no sense. Nothing happening in the real world that day, a few market jitters aside, could explain the plunge, and the market recovered almost as quickly as it had fallen. Now prosecutors claim that they’ve found a culprit: a London-based trader, Navinder Sarao, who may be extradited to the U.S. to face charges of market manipulation. Sarao is hardly your idea of a devious financial mastermind. He’s a thirty-six-year-old private investor who often made his trades from his bedroom, in his parents’ modest suburban house. His e-mails to regulators make him sound like a crank: “I trade very large but change my mind in a second”; “For the large part it is just my INTUITION.” Yet the S.E.C. and the Commodity Futures Trading Commission claim that he’s made millions of dollars trading S. & P. futures by cleverly scamming the market. Sarao denies all charges, and plenty of observers are skeptical that he had anything to do with the flash crash. Whether or not the authorities can make their charges stick, the case highlights a key truth about today’s market prices: on a day-to-day level, they are determined as much by computer algorithms as by human judgment.
NY Backs Bitcoin Exchange. But It May Not Fly in California - Ben Lawsky, New York’s superintendent of financial services, trumpeted the news with a tweet. “Big day. New York issues first charter to a virtual currency company,” the tweet read, just above an image of the charter, complete with Lawsky’s signature and an official New York seal. Lawsky and New York’s Department of Financial Services granted the charter on Thursday to itBit, officially approving the company’s bitcoin exchange for use in the state, and on the same day, itBit opened the exchange to people nationwide, saying the charter provided the legal framework needed to operate in all fifty states. Separately, itBit is adamant that the charter also allows it to operate in all other states. “By being organized under New york banking law, you more or less have reciprocity across the rest of the United States,” says itBit CEO Chad Cascarilla. He even says that the charter could allow the exchange to operate in places overseas (the exchange first launched in Singapore due to the regulatory uncertainty in the US). But as the statement from the California Department of Business Oversight shows, it’s not immediately obvious whether it can operate in all other states. What’s more, even in New York, itBit could have trouble winning customers under its current setup. The company’s exchange offers FDIC insurance, but this is through a third-party bank, and the company is not naming the bank. “That would be a an important issue. Investors should want to know what bank is providing these services,” Van Cleef says. “It’s important information to disclose to a customer.”
When Obama Talks About His "Massive Fight" With Wall Street, What Exactly Does He Refer To? -When Obama talks of a "massive fight" with Wall Street, is he referring to:
- the tens of billions in handouts handed to each and every bank, unleashing the age of socialized losses and privatized profits?
- the condification of the Too Big To Fail concept?
- presiding over a Department of "Justice" that openly admitted it would not prosecute certain bankers over fears of systemic collapse consequences, thus mathin up TBTF with Too Big To Prosecute?
- the implementation of Barney Frank which was supposed to rein in banks and instead had Citigroup lawyers and lobbysists write the language write the language in the Derivatives Swaps Out provision of the Omnibus bill as a result of $70.3 trillion in total Citigroup derivatives, which the bank knows will one day require another taxpayer bailout?
Congress Subpoenas DOJ Over ‘Too Big To Fail’ Bank Prosecutions - More than seven years after the financial crisis, Congress is still fretting that some megabanks might be "too big to fail." On Monday, members of the House Financial Services Committee subpoenaed three federal agencies over lingering questions as to whether regulators went easy on banks deemed to be too large to prosecute. Citing "extraordinary stonewalling" from the agencies in question, committee Chairman Jeb Hensarling, R-Texas, called for the Department of Justice, New York Federal Reserve Bank and Treasury Department to answer long-standing inquiries over the government's approach to bank prosecutions and other postcrisis decision-making. At the center of the lawmakers' concerns is the DOJ's settlement with U.K. bank HSBC concerning allegations that the lender failed to prevent its branches from laundering money for Mexican drug cartels and providing financing for state-designated terrorist regimes. During questioning in 2013 about the DOJ's settlement with HSBC -- which ended up paying $1.9 billion and signing a deferred prosecution agreement -- then-Attorney General Eric Holder told the Senate that some banks might indeed be too big to jail. "I am concerned that the size of some of these institutions becomes so large that it does become difficult for us to prosecute them," Holder said in March 2013, noting the dire economic ramifications of challenging banks central to global commerce. Subpoenas ordered by the Finance Committee two days after Holder's testimony have not been fully honored, Rep. Hensarling said in a statement. Committee members had also requested documentation of every instance in which DOJ officials ordered subordinates not to subpoena a major bank.
Partisan rancour hits US bank bill - FT.com: The launch of the most serious attempt at financial reform since the Dodd-Frank act quickly descended into partisan backbiting in Congress on Tuesday, diminishing the chances of substantive change. Republicans unveiled a draft bill that they said would lighten the burden of regulation for small and medium-sized banks, but Democrats criticised it as a grab bag of unacceptable measures that would help much bigger banks. The bill emerged from months of deliberation by Senator Richard Shelby, who became chairman of the Senate banking committee when Republicans took control of Congress at the start of this year. But with both sides accusing the other of being unwilling to work together, the day turned into another reminder that cross-party consensus remains as scarce as it has been for several years. Sherrod Brown, the top Democrat on the banking committee, said the bill would undermine important financial safeguards put in place to prevent a repeat of the last financial crisis. “This sweeping proposal holds Main Street financial institutions hostage to a partisan effort to dismantle Dodd-Frank’s consumer protections and sensible rules for the large banks and non-banks that played central roles in the financial crisis,” he said. Democratic staff said one of the proposed changes would reduce the liability risks that the US’s biggest banks were exposed to by their mortgage lending. Republicans offered a contrary take on the bill. Asked if it contained anything for the biggest Wall Street banks, a Republican committee staffer said: “There are no big bank asks or meetings. Not a factor in this process.”
Judge’s Ruling Against 2 Banks Finds Misconduct in ’08 Crash - Many on Wall Street have long argued that the banks did not generally break the law when they packaged shoddy mortgages and sold them to investors in the lead-up to the financial crisis of 2008.But on Monday, in the starkest of terms, a federal judge dealt a strong blow to that version of history. She ruled that two banks misled Fannie Mae and Freddie Mac in selling them mortgage bonds that contained numerous errors and misrepresentations.“The magnitude of falsity, conservatively measured, is enormous,” Judge Denise L. Cote of Federal District Court in Manhattan wrote in a scathing 361-page decision.The ruling came in a closely watched case brought by the government against the Japanese bank Nomura Holdings and Royal Bank of Scotland. They were the only two of 18 financial firms that took their case to trial, arguing that it was the housing crash, and not deceptive loan documents, that caused the bonds to collapse. The other firms — including Goldman Sachs and Bank of America — settled, together paying nearly $18 billion in penalties but avoiding a detailed public airing of their conduct.
5 Big Banks Expected to Plead Guilty to Felony Charges, but Punishments May Be Tempered - For most people, pleading guilty to a felony means they will very likely land in prison, lose their job and forfeit their right to vote.But when five of the world’s biggest banks plead guilty to an array of antitrust and fraud charges as soon as next week, life will go on, probably without much of a hiccup.The Justice Department is preparing to announce that Barclays, JPMorgan Chase, Citigroup and the Royal Bank of Scotland will collectively pay several billion dollars and plead guilty to criminal antitrust violations for rigging the price of foreign currencies, according to people briefed on the matter who spoke on the condition of anonymity. Most if not all of the pleas are expected to come from the banks’ holding companies, the people said — a first for Wall Street giants that until now have had only subsidiaries or their biggest banking units plead guilty.The Justice Department is also preparing to resolve accusations of foreign currency misconduct at UBS. As part of that deal, prosecutors are taking the rare step of tearing up a 2012 nonprosecution agreement with the bank over the manipulation of benchmark interest rates, the people said, citing the bank’s foreign currency misconduct as a violation of the earlier agreement. UBS A.G., the banking unit that signed the 2012 nonprosecution agreement, is expected to plead guilty to the earlier charges and pay a fine that could be as high as $500 million rather than go to trial, the people said.
UBS Shocked To Learn Ratting Out Fellow Criminals Doesn't Buy DOJ Immunity - Back in 2012, when the first massive marketwide-rigging scandal made the front pages, the prosecution's case was handed on a silver platter by one bank which hoped it would squeeze through the prosecutorial cracks by ratting out all of its heretofore complicit partners in crime: UBS. And sure enough, UBS did indeed get away with a paltry fine, and the whole affair was quietly swept under the rug with a December 2012 settlement, in which the U.S. agreed not to prosecute the bank on the condition that it “commit no United States crime whatsoever”for the two-year term of the agreement, subsequently extended by an extra year. Unfortunately for UBS, its reputation as a ratting squealer was all for nothing, because just over one year later UBS as well as virtually all the same banks that were manipulating Libor, were caught rigging that other massive, global market in secret online chatrooms such as the "Bandits" and the "Cartel": foreign currency rates. And also unfortunately for UBS which had sworn to commit no US crimes, it had just been caught committing at least one US crime. As a result, as Bloomberg reported earlier this week and as WSJ reported tonight, the US "Justice" Department is now tearing up and voiding the UBS 2012 settlement. Actually, make that two crimes: "UBS also was viewed by the Justice Department as a repeat offender, having reached previous settlements including one in 2011 related to antitrust violations in the municipal-bond investments market." Actually, make that three crimes: "[Justice Department criminal division head Leslie] Caldwell's message in the talks was stern: UBS was a recidivist having previously settled with the Justice Department over antitrust violations and had also obtained a deferred-prosecution agreement in 2009 to resolve charges it helped American taxpayers hide money overseas."
Forex Guilty Pleas and the New York Fed's Blinders: According to high priced media real estate, JPMorgan Chase and Citigroup are set to plead guilty as soon as next week to criminal charges brought by the U.S. Justice Department for colluding with other banks in the trading of foreign currencies, known on Wall Street as Forex. Guilty pleas are also expected by Royal Bank of Scotland and Barclays, while UBS, which cooperated early on in the probe, may receive a different charge. What has not garnered any media attention, however, is the unseemly role that the perpetually blindfolded regulator, the New York Fed, has played behind the scenes as two of the nation’s largest Wall Street banks head toward becoming admitted felons. Since January of 2014, the head of Foreign Exchange Trading at JPMorgan Chase, Troy Rohrbaugh, has served as the Chair of the Foreign Exchange Committee – a group sponsored by the New York Fed, JPMorgan’s regulator. Before Rohrbaugh became the Chair, Citigroup’s Jeff Feig chaired the Committee. (Feig left Citigroup last year to join Fortress Investment Group LLC.) The New York Fed’s Foreign Exchange Committee looks like an antitrust train wreck in motion. Its members are the commercial banks and investment banks that compete in foreign exchange and yet they are meeting six to eight times a year to discuss the market and set “best practices” for themselves — while some are simultaneously under criminal investigation for “worst practices.”
Lawler: Preliminary Table of Distressed Sales and Cash buyers for Selected Cities in April -- Economist Tom Lawler sent me the preliminary table below of short sales, foreclosures and cash buyers for a few selected cities in April. On distressed: Total "distressed" share is down in most of these markets mostly due to a decline in short sales (Mid-Atlantic is up year-over-year because of an increase in foreclosures in Baltimore). Short sales are down in these areas.The All Cash Share (last two columns) is declining year-over-year. As investors pull back, the share of all cash buyers will probably continue to decline. From Lawler: Note: The Baltimore Metro area is included in the overall Mid-Atlantic region (covered by MRIS). I am showing it separately because a large portion of the YOY increase in the foreclosure share of home sales in the Mid-Atlantic region was attributable to the almost 85% YOY increase in foreclosure sales in the Baltimore Metro area.
Mortgages, QE, and recovery --I have been watching for strong growth in mortgage lending as a signal of stronger real and nominal economic growth and interest rate increases. There have been some signs of strength, but, so far, April real estate loans on the balance sheets of commercial banks has been weak, after a positive trend change through the winter. (March was boosted by a technical change in the data, but still appeared to show a continuation of acceleration, which has disappeared in April.) It could be that the MBS market is recovering, and a high proportion of net new mortgages are not staying on bank balance sheets. Less than a quarter of residential mortgages are on bank balance sheets. This is an easy weekly number to check, but it is incomplete. The number for 2015 1Q housing debt in Tuesday morning's Household Debt and Credit Report may shed some light on this. The Mortgage Bankers Association is showing strong Q1 activity, in both single family and multi-unit housing.Here is a graph of the marginal change in Commercial & Industrial Loans and Closed End Residential Real Estate Loans on Commercial Bank balance sheets since the end of 2007. I think we can see some of the idiosyncrasies of this recession in this data. Notice that C&I Loans have grown at a very steady rate throughout the recovery, regardless of monetary policy. I The real estate loans behaved differently. Keep in mind that they should have been increasing at a rate slightly higher than C&I Loans. I think what we are seeing there is that during QEs, cash was making its way into the real estate asset class. All-cash investors were buying homes from overleveraged households. This process was accelerated during QEs. As QEs were ended or tapered, this activity declined or grew at a slower rate, and new mortgage originations once again would begin to push mortgages outstanding higher. This happened as QE3 tapered, but mortgages at the banks leveled off at the end of 2014. A new rise in these loans is one signal I am looking at. This recovery is mostly about getting capital back into real estate.
MBA: Mortgage Applications Decrease in Latest Weekly Survey -- From the MBA: As Rates Climb, Refinance Applications Continue to Drop Mortgage applications decreased 3.5 percent from one week earlier, according to data from the Mortgage Bankers Association’s (MBA) Weekly Mortgage Applications Survey for the week ending May 8, 2015. ... The Refinance Index decreased 6 percent from the previous week. The seasonally adjusted Purchase Index decreased 0.2 percent from one week earlier. The unadjusted Purchase Index increased 0.1 percent compared with the previous week and was 12 percent higher than the same week one year ago. ...The average contract interest rate for 30-year fixed-rate mortgages with conforming loan balances ($417,000 or less) increased to 4.00 percent, its highest level since March 2015, from 3.93 percent, with points increasing to 0.36 from 0.35 (including the origination fee) for 80 percent loan-to-value ratio (LTV) loans. The first graph shows the refinance index. 2014 was the lowest year for refinance activity since year 2000. It would take much lower rates - below 3.5% - to see a significant refinance boom this year. The second graph shows the MBA mortgage purchase index. According to the MBA, the unadjusted purchase index is 12% higher than a year ago.
Mortgage News Daily: Mortgage Rates at 2015 Highs, Average Lender at 4% --From Matthew Graham at Mortgage News Daily: Mortgage Rates Keep Pushing 2015 Highs Mortgage rates moved disconcertingly higher again today, despite the fact that underlying market levels actually improved during the day. Guaranteeing rates in such a volatile environment is expensive for lenders. The result is yet another high for 2015. The average lender is quoting conventional 30yr fixed rates of 4.0% on top tier scenarios. Just a few short weeks ago, the average rate was 3.625%. That makes this the most abrupt move higher in roughly 2 years, with the last notable example being the mid-2013 'taper tantrum.' Here is a table from Mortgage News Daily:
Foreign Money Is Pouring Into U.S. Real Estate, and It's Not Just Houses -- Blockbuster real estate deals are back and breaking records as cash from around the globe pours into U.S. office buildings, apartment complexes and other investment properties. Commercial real estate transactions jumped 45 percent by dollar volume in the first quarter, an increase driven by sales of multiple buildings or entire companies, according to research firm Real Capital Analytics Inc. Since then, General Electric Co. agreed to sell real estate assets to Blackstone Group LP and Wells Fargo & Co. in a deal valued at about $23 billion, the largest property purchase since the financial crisis. As the pot of money set aside for U.S. commercial real estate grows, competition for the best properties is pushing investors to buy in bulk. Based on the pipeline, which includes the GE deal, the second quarter may be one of the biggest on record for property transactions, according to Real Capital. Demand for property from warehouses to skyscrapers is booming, helped by more than six years of Federal Reserve efforts to stimulate economic growth by keeping interest rates low, and stockpiles of cash from overseas investors seeking a haven. About $24 billion in foreign capital flowed to U.S. properties in the first quarter, more than half the total for all of 2014, according to Cushman. That number is poised to grow further because the majority of sovereign wealth funds -- investors such as GIC -- have yet to hit their target allocations for real estate. Total property allocations for such funds now top $6.3 trillion, more than double the amount in 2008, London-based Preqin said in a report this month. Centrally located office towers are fetching prices 33 percent above records set in 2008, according to an index from Real Capital and Moody’s Investors Service.
How Soaring Housing Costs Impoverish a Whole Generation and Maul the Real Economy -- Wolf Richter: How many years would it take first-time homebuyers, earning a median household income, to save enough money for the standard 20% down payment on a median home? Are you sitting down? An impossibly long time in many cities, Lindsay David found in his report on mortgage stress. He looked at 30 large US cities, using their local median incomes and median home prices. It assumed that young households could accomplish the tough feat of saving 5% of their income, year after year, through bouts of unemployment, illness, shopping sprees, family expansions, or extended vacations. The results are stunning – if just a tad discouraging for first-time buyers. In my beloved and crazy boom-and-bust town of San Francisco, where a median home (for example, a two-bedroom no-view apartment in a so-so neighborhood) costs $1 million, it would take – are you ready? – 37 effing years. Given its higher median income, San Francisco is only in second place. The winner by a few months is another Bay Area city, San Jose. In San Diego, it would take 33 years. In Los Angeles, 32 years. First-time buyers might be retired before they scrape their theoretical down payment together. Theoretical, because in reality, too many things change, and they’re chasing after a moving target. So lower your expectations and step down to buy a below-median home? Here is what TwistedPolitix found on the market in that price category: Yes folks, step right up and get your 700 sq. ft. home in Redwood City, California, heart of the Silicon Valley, for just $649,000! The American Dream! 1 bedroom, 1 bath for just $3,154 per month on a mortgage with super low interest rates if you put down 20%. If you pay the mortgage back according to the standard 30-year schedule, in April 2045 you will have paid $1,135,721 for a tiny little [bleep] shack. Brilliant! And that 20% down payment would still amount to $130,000. How long would it take first-time buyers with a median household income to save up this much money? About a quarter century!
FNC: Residential Property Values increased 4.6% year-over-year in March -- FNC released their March 2015 index data today. FNC reported that their Residential Price Index™ (RPI) indicates that U.S. residential property values increased 0.9% from February to March (Composite 100 index, not seasonally adjusted). The 10 city MSA increased 0.6% in March, and the 20-MSA and 30-MSA RPIs both increased by about 0.9% in March. These indexes are not seasonally adjusted (NSA), and are for non-distressed home sales (excluding foreclosure auction sales, REO sales, and short sales). In addition to the composite indexes, FNC presents price indexes for 30 MSAs. FNC also provides seasonally adjusted data. The year-over-year (YoY) change was slightly higher in March than in February, with the 100-MSA composite up 4.6% compared to March 2014. For FNC, the YoY increase had been slowing since peaking in March at 9.0%, but had held steady for the last few months. The index is still down 18.6% from the peak in 2006 (not inflation adjusted). This graph shows the year-over-year change based on the FNC index (four composites) through March 2015. The FNC indexes are hedonic price indexes using a blend of sold homes and real-time appraisals.Most of the other indexes are also showing the year-over-year change mostly steady at around 5% for the last several months.
CoStar: Commercial Real Estate prices increased in March -- Here is a price index for commercial real estate that I follow. From CoStar: Property Prices Surge Upward In the First Quarter Of 2015: The value-weighted U.S. Composite Index, which is influenced by high-quality assets in core markets, advanced by 4.7% in the first quarter of 2015 and is now 11% above the previous peak in 2007. The equal-weighted U.S. Composite Index, which weighs each transaction equally and therefore reflects the impact from more numerous smaller deals, rose 4.8% in the first quarter of 2015, although it remains 10% below its previous peak level. As the CRE recovery extended to more markets and property types, all major property types and regional sectors posted double-digit annual gains through March 2015. The Multifamily Index has already fully recovered, eclipsing its previous peak, while the Retail and Industrial Indices advanced to within 10% of their previous peak levels and the Office Index remained 15% below its previous high-water mark in 2007. Among CCRSI’s regional indices, strong investor demand in core coastal metros propelled the Northeast Composite Index 6.1% above its prior peak, while the West Composite Index moved to within 8.4% of its prior peak in March 2015.
Home Sales to Hit Highest Level Since 2006, Realtors Say - Existing-homes sales this year are expected to hit levels not seen since just after the peak, in 2006, driven by strong job growth, low interest rates and a gradual loosening of lending standards, according to the National Association of Realtors. Lawrence Yun, chief economist at the Realtor association, said in his mid-year forecast on Thursday that he expects home sales to end up around 5.3 million in 2015, a significant pickup from 4.9 million sales in 2014. Last year, economists also anticipated robust growth in the home sales, but were disappointed when a spike in interest rates early in the year and poor wage growth dampened the market. Mr. Yun said that early results this year point to a pickup in home sales, including sales in the first few months, foot traffic at homes on the market and strong job growth. Buyers who have been kept out of the market by low wages and strict lending standards are likely to start coming back. “There is sizeable pentup demand,” he said in an interview. To be sure, the volume of sales Mr. Yun is anticipating remains well below recent high in 2005 when more than 7 million homes were sold. Mr. Yun said the market is likely a decade off from hitting those levels again. In 2006, sales fell to 6.5 million and since then have hovered around 5 million sales or fewer. If interest rates or prices rise, making houses less affordable, that could hold back the volume of sales, which Mr. Yun said shows the need for more new-home construction.
Just Released: Mortgage Borrowing among Most Creditworthy Abates - NY Fed - Today’s release of the New York Fed’s Quarterly Report on Household Debt and Credit for the first quarter of 2015 reports a flattening in household debt balances. The slow growth in debt balances has left many wondering about the dynamics behind this change—who is borrowing, and who is paying down their balances? Thus, we use the same data set, the New York Fed Consumer Credit Panel (which is itself based on Equifax credit data) to identify the changes in balances by credit score, updating a post from last year with more recent data and also providing an in-depth look at the change in mortgage balances. The charts below show contributions to changes in debt balances by borrowers’ credit scores (Equifax Riskscores), first looking at the data we presented in our earlier post (2012:Q4 to 2013:Q4) and then the most recent data, from 2014:Q1 to 2015:Q1. Since the figures are expressed as growth contributions, summing the numbers for a given loan type produces the overall percentage growth for that type over the relevant four-quarter period. The changes in contributions since 2013 are relatively modest, but there have been some important developments. The first notable difference is that credit card balances rose more democratically this time—with borrowers with credit scores over 620 all contributing to the increased balance. And there’s one difference that stands out even more, which is that the most creditworthy borrowers held back housing debt growth even more significantly during the most recent four-quarter period.
NY Fed: Household Debt increased slightly in Q1 2015 -- Here is the Q1 report: Household Debt and Credit Report. From the NY Fed: Delinquencies, Foreclosures and Bankruptcies Improve as Household Debt Stays Flat The Federal Reserve Bank of New York’s Household Debt and Credit Report revealed that aggregate household debt balances were largely flat in the first quarter of 2015. As of the end of March, total household indebtedness was $11.85 trillion, a $24 billion, or 0.2 percent, increase during the first quarter of this year. The report is based on data from the New York Fed’s Consumer Credit Panel, a nationally representative sample drawn from anonymized Equifax credit data. The slowdown in growth can be attributed to a negligible uptick in mortgage balances, which are the largest component of household debt. Mortgage balances stood at $8.17 trillion in the first quarter. Additionally, balances on home equity lines of credit (HELOC), which were $510 billion at the end of fourth quarter, 2014, were unchanged in the first quarter of this year. Non-housing debt balances increased by 0.7 percent from the end of last year, largely due to increases in student loans ($32 billion) and auto loans ($13 billion). These gains were partially offset by a $16 billion decline in credit card balances. Measures on delinquencies, foreclosures and bankruptcies all improved in the first quarter. The percentage of outstanding debt in some stage of delinquency fell to 5.7 percent from 6.0 percent in the fourth quarter of 2014, with continuing improvements in mortgages. About 112,000 individuals had a new foreclosure notation added to their credit reports in the first quarter of this year, the lowest total since at least 1999. Four percent fewer consumers had a bankruptcy notation added to their credit reports, bringing the quarterly total to its lowest point since early 2006. Here are two graphs from the report: The first graph shows aggregate consumer debt increased slightly in Q1. Household debt peaked in 2008, and bottomed in Q2 2013. The recent increase in debt suggests households (in the aggregate) deleveraging is over. The second graph shows the percent of debt in delinquency. The percent of delinquent debt is generally declining, although there is still a large percent of debt 90+ days delinquent (Yellow, orange and red).
Household Spending Growth Expectations Plunge; Recession Already Started? -- Every month the Fed does a Survey of Consumer Expectations for inflation, earnings growth, income growth, and consumer spending growth. In the microeconomic data overview, the Fed provided charts for the first three sets of expectations. I downloaded the data and created my own chart of spending expectations. First let's consider some details from the report. The results from the April 2015 Survey of Consumer Expectations indicate that one-year ahead inflation expectations fell while three-year ahead inflation expectation increased. The median one-year and three-year ahead expected rates of inflation now stand at 2.7% and 3.0%, respectively. While earnings and household income growth expectations were largely unchanged, median household spending growth expectations retreated significantly from the last month.In spite of rising earnings and income estimates, "median household spending growth expectations retreated significantly from the last month" in the Fed's words. In general, I do not place much faith in these estimates, especially inflation expectations. That said, the spending estimates do ring true with weak economic data that we have seen for six months. Should these spending projections prove to be correct, a US recession that few if any economists see coming, has already started.
Energy prices and consumer spending -- Among the disappointments in the 2015:Q1 GDP figures was weak consumption growth, which was a little surprising given the extra cash most consumers have on hand as a result of lower energy prices. I wanted to take a look at how the recent consumer behavior compares with what we’ve seen historically. The graph below plots the price of energy goods and services relative to the overall price consumers pay for other purchases. Real energy prices have fallen about 20% from where they had been last summer. As before the green line indicates what we would have expected to see happen to consumption spending given the big drop in energy prices. Initially consumption was higher than predicted, with big gains in consumption spending coming before much of the decline in energy prices had actually reached consumers. But consumption since November has grown at a slower rate than would have been predicted even if there had been no drop in energy prices. Based on the historical relation between energy prices and consumer spending, we would have expected to see consumption today about 2.6% above where it had been in August rather than the observed 2.2% increase. What’s different this time? Of course energy prices are just one of many factors influencing consumption spending and the differences highlighted above are modest. But the Wall Street Journal last week reported on a survey by credit-card issuer Visa that 70% of American consumers expect gasoline prices to go back up. This time consumers don’t trust the windfall to stay in their wallets, and so haven’t been spending the extra cash as freely as in the past. Whatever the explanation, the facts seem to be that, unlike what we usually observed historically, consumers have been using much of the gains from lower energy prices to bolster their saving rather than using it to increase spending on other goods and services.
UMich Consumer Sentiment Crashes As Surging Gas Prices Trump Stock Record Highs -- Soaring gas prices dueled with soaring stock prices to leave University of Michigan Consumer Sentiment and it appears the former won. Printing at the weakest level since Oct 2014, UMich dropped to 88.6 (vs 95.9 expectations). This is the biggest miss on record.. and biggest MoM drop since Dec 2012. Both current conditons and expectations plunged despite surges in inflation expectations. Higher income expectations are starting to plunge - at their lowest in 7 months - and household finances are seenas the worst since July 2014. And finally, the survey's spokspersonsays that respondents showed "concern over employment."
Consumer Confidence Plunges Below Any Economist’s Estimate; Consumers Shock Economists - Consumer confidence is the third miss by economists in a single day. Please consider the Bloomberg Consensus Estimate for Consumer Confidence. Consumer confidence has fallen back noticeably this month, down more than 6 points to a much lower-than-expected 95.2. This compares very poorly with the Econoday consensus for 103.0 and is even far below the Econoday low estimate of 100.5. The weakness, ominously, is the result of falling assessments of the jobs market, both the current jobs market and expectations for the future jobs market. The second quarter, which is expected to be much stronger than the weather-depressed first quarter, isn't likely to get off to a fast start, at least as far as this report goes.The most striking weakness in April is the assessment of future conditions with the expectations component down 8.5 points to 87.5 for the weakest reading going all the way back to September. And the most striking weakness among the sub-components is employment, where fewer see more jobs opening up 6 months from now and more see fewer jobs available. This spills over into income where fewer see an increase ahead and more see a decrease.But also weak is the present situation component which is down more than 2-1/2 points to 106.8 for its weakest reading since December. Here the most closely watched sub-component is the jobs-hard-to-get reading which is up nearly 1 full percentage point to 26.4 percent. This reading will hold back expectations at least to some degree for a big bounce back in the April employment report from a very weak March. Not only was the consensus outside the range of reading predictions, economists did not even get the leading sign correct. Economists expected an improvement from 101.3 to 103.0 but instead the index plunged 7.6%.
Consumer Comfort Tumbles For Longest Streak In 18 Months -- Confirming Gallup's demise of the confidence of the consumer, Bloomberg's non-government-sanctioned Consumer Comfort index has now fallen for the 5th straight week - the longest streak of uncomfortableness since Nov 2013. The index is barely above unchanged for 2015 with people in The South and NorthEast feeling the misery the most in the last week (and rather oddly, only the 65+ age cohort saw an improvement - rising rates?). Charts: Bloomberg
Continued Weak Consumer Spending "Puzzles" BofA -- BofAML's Michelle Meyer is "puzzled" at why the US consumer is not the spendaholic her textbooks said they should be by now... A setback after the bounce in March Based on BAC internal data, which tracks spending on credit and debit cards, consumer spending slowed in April. Retail sales ex-autos declined 0.1% mom seasonally adjusted after climbing 0.8% in March. It is prudent to smooth through the last three months, which reveals an average monthly gain of 0.3%. Given the great deal of noise in the data, it is helpful to examine spending trends by sector. Department store sales were the weakest, maintaining the post-recession trend of contraction. The housing-related sectors were also sluggish, with a decline in spending on home improvements and home goods. There seemed to be a weaker trend to the former, but the drop in home goods looked like a reversal from recent strength. On the other end, there was a notable gain in spending at electronic stores, which we think may have partly owed to the launch of the Apple iWatch. As we show in Chart 2, prior releases of Apple products caused notable spikes in spending, which the seasonal adjustment process did not capture. We are left puzzled by the weak April consumer spending data - we expected the consumer to be a tailwind for growth in this year, offsetting the drag from weaker investment and manufacturing. Even accounting for the softer jobs data in the past two months, the labor market added an average of 255,000 jobs a month over the past six months. Consumers have benefited from lower gasoline prices and confidence has picked up.
Retail Sales unchanged in April -- On a monthly basis, retail sales were unchanged from March to April (seasonally adjusted), and sales were up 0.9% from April 2014. From the Census Bureau report: The U.S. Census Bureau announced today that advance estimates of U.S. retail and food services sales for April, adjusted for seasonal variation and holiday and trading-day differences, but not for price changes, were $436.8 billion, virtually unchanged from the previous month, but 0.9 percent above April 2014. ... The February 2015 to March 2015 percent change was revised from +0.9 percent to +1.1 percent.
April Retail Sales: The Spring Rebound Goes Missing - The Advance Retail Sales Report released this morning shows that sales in April came in flat month-over-month, a situation that was enabled by an upward March revision from 0.9% to 1.1%. Core Retail Sales (ex Autos) came in at a disappointing 0.1%, with the March number tweaked upward from 0.4% to 0.7%. Today's numbers came in below the Investing.com forecast of 0.2% for Headline Sales and 0.5% for Core Sales. The mainstream expectation of spring bounce in sales after a severe winter hasn't happened. The chart below is a log-scale snapshot of retail sales since the early 1990s. The two exponential regressions through the data help us to evaluate the long-term trend of this key economic indicator. The year-over-year percent change provides another perspective on the historical trend. Here is the headline series. Here is the year-over-year version of Core Retail Sales. The next two charts illustrate retail sales "Control" purchases, which is an even more "Core" view of retail sales. This series excludes Motor Vehicles & Parts, Gasoline, Building Materials as well as Food Services & Drinking Places. Here is the same series year-over-year. Note the highlighted values at the start of the two recessions since the inception of this series in the early 1990s.
No Q2 Hope From Retail Sales - April Retail Sales has assuredly disappointed Wall Street and is just one report in a series indicating the U.S. economy has gone into standby mode. Retail sales had no growth and even excluding gasoline sales only grew 0.1%. Autos & parts dropped -0.4% for the month. Without autos & parts sales, April retail sales increased 0.1%. Gasoline sales declined by -0.7%. Sporting goods & hobby stores showed a 0.8% increase but department stories sales declined by -2.2%. Retail sales have now increased only 0.9% from a year ago and that's really not great. Worse, all of 2014 retail sales were revised downward by -1.2% than previously reported. Retail sales are reported by dollars, not by volume with price changes removed. Retail trade sales are retail sales minus food and beverage services and these sales were down -0.1% for the month. Retail trade sales includes gasoline. Total April retail sales were $436.8 billion. Below are the retail sales categories monthly percentage changes. These numbers are seasonally adjusted. General Merchandise includes Walmart, super centers, Costco and so on. Furniture dropped by -0.9%. Below is a graph of just auto sales. Auto sales and parts sales are huge part of retail sales and declined -0.4% for the month and for autos alone, -0.3%. For the year, motor vehicle sales have increased 5.1%. Autos & parts together have increased 4.5%Below are the retail sales categories by dollar amounts. Autos and parts is more than groceries and almost rivals groceries, booze and eating out combined.Graphed below are weekly regular gasoline prices, so one can see what happened to gas prices in April. Gasoline station sales are down a whopping -22.0% from a year ago. Gas prices are projected to be the lowest since 2009 for that summer roadtrip, although lately one must wonder where that projection is coming from. The below pie chart breaks down the monthly seasonally adjusted retail sales by category as a percentage of total April sales by dollar amounts. The dependency on autos in this country for retail sales is astounding. Retail sales correlates to personal consumption, which in turn is about 70% of GDP growth. ( GDP has inflation removed from it's numbers). Below is the graph of retail sales in real dollars, or adjusted for inflation, so one gets a sense of volume versus price increases. Below is the annualized monthly percentage change in real retail sales, monthly, up to March 2015. This is a crude estimate since CPI is used instead of individual category inflation indexes. The below graph can give some insight as to what consumer spending might shape up to be for Q2 2015 and as we can see things are not looking good so far.
Dismal Retail Sales Numbers Suggest Recession Likely Underway: Overall +0.0%, YoY +0.9%, Department Stores -2.2% -- Economists were surprised by the dismal retail sales report this morning. The Bloomberg Consensus estimate was a rise of 0.0%, but sales came in at 0.0% and the details were ugly, emphasis mine. Consumer confidence may be strong but it still is not translating to strength for consumer spending. Retail sales were unchanged in April vs Econoday expectations for a 0.2 percent gain. Excluding autos, sales did rise but only barely at plus 0.1 and below expectations for 0.5 percent, while excluding both autos and gasoline, sales rose 0.2 percent vs expectations for a 0.4 percent gain. The surprising part of the report isn't the weakness in motor vehicles, which was signaled by weak unit sales and which fell 0.4 percent in the month, but weakness in some of the core readings including department stores which fell a very steep 2.2 percent and electronics & appliances which fell 0.4 percent for a 7th straight decline. Both furniture and food & beverages also show declines. Year-on-year rates show just how weak growth in the retail sector has been. Total retail sales are up only 0.9 percent year-on-year, down from 1.7 percent in March. This is the lowest rate since late 2009. Excluding motor vehicles, year-on-year sales are unchanged, again the lowest reading since late 2009. Ex-auto ex-gas, sales are up a respectable 3.4 percent but, compared to 3.9 percent in March, are going in the wrong direction. The Census Department offers this Table of Retail Sales. Note the huge patch of negative numbers. At least people are still eating out and drinking more. Also note the negative numbers in the November 2014 through January 2015 column. Economists expected the decline in gasoline sales (down 7.2%) to translate into increased sales elsewhere. It didn't.
US Retail Sales Hint At Recession, Weakest Since Financial Crisis -- Despite bouncing back last month at the fastest pace in a year, April just printed the slowest YoY growth since Nov09 at just 0.9% (retail sales has still missed expectations for 4 of the last 5 months). Against expectations of a 0.2% MoM rise in April (considerably slower than the 0.9% pop in March), Retail Sales missed with a 0.0% change. Ex-Auto and Gas MoM also missed with a mere 0.1% gain (aghainst +0.5% exp.) but it was the control group that saw the biggest miss, printing 0.0% (against hopeful expectations of a 0.5% gain). There was widespresd weakness with outright declines in autos, furniture, gas, food, electronics (AAPL hangover), and general merchandise. What is curious is that moments ahead of the release, sellsiders were overslling the retail print to appear far more important than it is, in hopes for a big beat. CRT strategist David Ader says in note that "Retail Sales is, oddly, perhaps more important than NFP..."MoM saw a modest reveision in march save it from 5 monthly misses in a row: Year-over-Year retail sales growth slowest since July 2008's slump: Worse, non-seasonally adjusted retail sales which however are perfectly relevant on a Y/Y basis as the same seasonal adjustment takes place every 12 months, posted their first decline since the Great Recession. And the Control Group shows no signsof improvment post-weather or post-gas savings...
The Big Lie: Serial Retail Sales Downward Revisions Hide Ugly Truth -- Over the last 5 years, over 20% of the initial gains in Retail Sales have been 'removed' by serial downward revisions in later months. For over 65% of the time, a 'good' number prints, stocks rally, the everything-is-awesome meme is confirmed, and then a month later (or more) retail sales data is downwardly revised. 35 downward revisions and 19 upward (and 8 of last 9 downward) for an aggregate spread between initial data and revised of over 5 percentage points (of a 25% gain). It is all too easy to point the finger at China's 'manufactured' data, but perhaps some reflection on the home truths in America is worthwhile. Charts: Bloomberg
Where Americans Spend Their Money - April’s retail sales report didn’t offer much in the way of bright spots. Overall sales barely budged and have now been down or flat for four of the past five months. Tepid spending by American consumers has been a puzzle for many economists. Employers are adding jobs, wages have shown tentative signs of picking up, gasoline prices are way down from a year ago and polls show growing confidence. Americans have gotten a windfall from cheaper gasoline prices. But so far, they appear to be saving some of that money rather than spending it. It hasn’t been all doom and gloom. Some discretionary spending has been particularly strong. Restaurant and bar sales jumped 0.7% last month, suggesting Americans are willing to shell out money on nonessentials. That may be coming at the expense of grocery store sales, though. And in another sign that many households are merely shifting expenses–and habits–rather than boosting spending, nonstore retailers (largely online sales but also those via infomercials, catalogs, door-to-door sales and vending machines) saw a healthy gain last month while department stores continued their long decline.
“Vanity capital” is the new metric for narcissism, and analysts say its value worldwide is greater than Germany’s GDP – Quartz: Last month, Bank of America Merrill Lynch released the compellingly titled report, “Vanity Capital: The global bull market in narcissism,” which put a price tag on the amount we spend globally on products and services that enhance our appearance or prestige. That price tag is huge: $4.5 trillion, according to the report—larger than the fourth largest economy in the world, Germany, with its GDP of $3.7 trillion—and still growing. The immediate question the report raises is whether it’s even possible to measure such a thing. The premise—to quantify the dollar value of all purchases worldwide motivated in some way by vanity—is a little nutty at its foundation. The authors define “vanity capital” in terms that sound like Gordon Gekko and Abraham Maslow got together to deliver a self-help seminar: It’s “the pursuit of, and the accumulation of, attributes and accessories to augment self-confidence by enhancing one’s appearance and prestige. It is self-actualization through self-improvement and self-focus.” On top of that, the process of separating vanity from non-vanity purchases is a rather subjective one. Some of the goods and services categorized as vanity capital seem fair enough: jewelry, art, a private jet, or basically anything you’d see on Rich Kids of Instagram. But is your smartphone a vanity spend, or a practical necessity? Do you wear a wedding ring to enhance your appearance or prestige? As for spending on services instead of products: Sure, a getting botox treatment is somewhat vain, but what about pursuing an Ivy League education?
Legislators Introduce Bill Calling For Nationwide Ban On Non-Disparagement Clauses -- Non-disparagement clauses are one of the stupidest things any company can enact. In most cases, it's almost impossible to enforce them, no matter how artfully crafted. Most aren't. Most non-disparagement clauses found lying around the internet have been lazily copied and pasted from pre-existing bad ideas instituted by other companies. On top of the legally-dubious aspects, there's the potential for severe backlash -- something that completely underscores the futility of these half-assed gag orders. Instead of heading off criticism, these clauses tend to invite negative reviews, often from internet denizens who've never patronized the company they're bashing at multiple review sites. But still, these clauses persist. Up until recently, the court of public opinion has had to do most of the heavy lifting when it came to the enforcement of these clauses. Last September, California became the first state in the nation to ban non-disparagement clauses, threatening violators with fines up to $10,000 (for repeated violations). Now, the federal government is taking another swing at bad companies hiding behind worse legal language.
Cost of oil consumption to US GDP (graph) Look at that recent drop. US Consumption hasn't dropped off dramatically. The Bond market has been going haywire recently and I'm sure that the yield curve is getting closer to negative. But is this drop in oil prices going to boost the economy? Or is it indicative of an economy about to go into recession. Stay tuned.
Rail Week Ending 09 May 2015: Data Still Not Pretty. Rail Softness Continues.: Week 18 of 2015 shows same week total rail traffic (from same week one year ago) declined according to the Association of American Railroads (AAR) traffic data. Intermodal traffic improved, which accounts for half of movements - but weekly railcar counts goes deeper into contraction. A summary of the data from the AAR: The Association of American Railroads (AAR) today reported U.S. rail traffic for the week ending May 9, 2015. For this week, total U.S. weekly rail traffic was 551,034 carloads and intermodal units, down 2.3 percent compared with the same week last year. Total carloads for the week ending May 9, 2015 were 273,433 carloads, down 7.9 percent compared with the same week in 2014, while U.S. weekly intermodal volume was 277,601 containers and trailers, up 3.8 percent compared to 2014. Four of the 10 carload commodity groups posted increases compared with the same week in 2014. They include: motor vehicles and parts, up 8.9 percent to 18,997 carloads; petroleum and petroleum products, up 6.1 percent to 15,464 carloads; and miscellaneous carloads, up 3.6 percent to 9,220 carloads. Commodity groups that saw decreases during this one week included: coal, down 16.1 percent to 93,691 carloads; metallic ores and metals, down 12.1 percent to 23,572 carloads; and grain, down 11.2 percent to 17,959 carloads. For the first 18 weeks of 2015, U.S. railroads reported cumulative volume of 5,043,559 carloads, down 1.8 percent from the same point last year; and 4,679,513 intermodal units, up 1.7 percent from last year. Total combined U.S. traffic for the first 18 weeks of 2015 was 9,723,072 carloads and intermodal units, a decrease of 0.1 percent compared to last year. North American rail volume for the American rail volume for the week ending May 9, 2015 on 13 reporting U.S., Canadian and Mexican railroads totaled 368,931 carloads, down 7.5 percent compared with the same week last year, and 350,845 intermodal units, up 3.2 percent compared with last year. Total combined weekly rail traffic in North America was 719,776 carloads and intermodal units, down 2.6 percent. North American rail volume for the first 18 weeks of 2015 was 12,681,610 carloads and intermodal units, up 1 percent compared with 2014.
Why the Heck Is the Trucking Business Slowing Down? - Wolf Richter: I was forewarned. On April 25, Julian the trucker posted this comment: Have been trapped on the West Coast for the last week. Freight has slowed to a crawl, with way too much time on the loads, and the truck stops are filling up too early in the day. We usually experience slowdowns before the rest of the country becomes aware of them. On May 2, he wrote: I have lost 5 days either waiting for a load or waiting to load or deliver, since leaving on the 12th of April. I have seen this pattern before in my 34 years of trucking – we always get hit first in any downturn, just as we always feel the upturn first. And on May 4, he wrote:Freight is still slow. I barely have 7,000 miles on the clock since the 12th of April. A normal month is 10,000 + miles. In reality, as Julian experienced, and as it turns out other truckers experienced, shipping volumes by truck fell in March from prior year. It seemed like a fluke, something that would bounce back in April, but in April, according to the just released Cass Freight Index, shipping volumes by truck fell again. These two months in a row of year-over-year declines came as a particular surprise because 2014 had been a banner year, according to the American Trucking Association. On Monday, it reported that revenues by trucking companies jumped to an all-time record of $700.4 billion, finally beating the prior record set before the Financial Crisis. This vast $700-billion machinery with its 3.4 million drivers that hauled nearly 10 billion tons last year – 69% of the nation’s freight – is an excellent early warning system for the overall economy. So when the spot rates for tractor-trailers started dropping in April, it triggered all kinds of explanations at the time, for example, in the Journal of Commerce: Rather than a sign of underlying economic weakness, the softening spot market may indicate shippers are finding the trucking capacity they need, for now, with contractual partners. Given the exuberance of 2014, carriers have added lots of new trucks to replace older equipment and to add capacity, but by mid-April, the phrase “excess capacity” started cropping up. And the idea that the spot market was suffering as shippers were relying more on their contractual partners made sense.
Import prices fall for 10th straight month -- U.S. import prices fell for a 10th straight month in April, likely reflecting the impact of a strong dollar, a sign of benign inflation pressures that could encourage the Federal Reserve to delay raising interest rates. The Labor Department said on Wednesday import prices fell 0.3 percent last month after slipping 0.2 percent in March. Economists polled by Reuters had forecast import prices rising 0.3 percent. In the 12 months through April prices fell 10.7 percent. The dollar, which has gained about 11 percent against the currencies of the United States' main trading partners since June, and lower crude oil prices are keeping a lid on price pressures. That has left inflation running well below the Fed's 2 percent target. Persistently low inflation gives the U.S. central bank ample room to keep its ultra-low interest rate policy a while longer, while it looks for strong signals of the economy's recovery after it weakened sharply in the first quarter. The Fed has kept its key short-term interest rate near zero since December 2008. Last month, imported petroleum prices rose 1.0 percent after increasing 1.6 percent in March. Import prices excluding petroleum fell 0.4 percent in April after a similar decline in March. Imported food prices slipped 0.9 percent after dropping 0.7 percent in March. The report also showed export prices declined 0.7 percent last month after edging up 0.1 percent in March. Export prices fell 6.3 percent in the 12 months through April.
Import Prices Plunge For 9th Month In A Row, Biggest Drop Ex-Fuel Since 2009 -- US Import Prices fell 10.7% in April (missing expectations of a 9.7% decline) making this the longest streak of YoY declines outside of a recession in history. In fact, YoY Import Prices have only risen 5 times in the last 36 months. This is also the 10th monthly decline in import prices (-0.3% vs +0.3% expectations) with with Food and Beverage prices dropping the most and non-fuel-related import costs dropping the most since 2009 and imports ex-fuel and food fell 2.2% YoY in April. The biggest price deflationary pressures appear to come from ASEAN with overall manufactured goods sliding 0.4% against non-manufactured rising 0.5% in April. YoY Import Prices have only risen 5 times in the last 36 months... And before you blame it all on oil prices... not so fast...
Producer Price Index for Final Demand Hits a New Low -- Today's release of the March Producer Price Index (PPI) for Final Demand came in at -0.4% month-over-month seasonally adjusted. That follows the previous month's 0.2% increase. Core Final Demand (less food and energy) came in at -0.2% month-over-month following a 0.2% change the month before. The Investing.com forecasts were for 0.2% headline and 0.1% core. The year-over-year change in Final Demand is -1.3%, the lowest in the brief history of this data series. Here is the summary of the news release on Finished Goods: The Producer Price Index for final demand fell 0.4 percent in April, seasonally adjusted, the U.S. Bureau of Labor Statistics reported today. Final demand prices moved up 0.2 percent in March and decreased 0.5 percent in February. On an unadjusted basis, the index for final demand declined 1.3 percent for the 12 months ended in April.... In April, more than 70 percent of the decrease in final demand prices can be attributed to a 0.7-percent decline in the index for final demand goods. Prices for final demand services edged down 0.1 percent. More… Now let's visualize the numbers with an overlay of the Headline and Core (ex food and energy) PPI for finished goods since 2000, seasonally adjusted. The plunge over the past several months in headline PPI is, of course, energy related -- now fractionally off its interim low set last month. Core PPI has remained relatively stable over the past year.
Producer Prices, Import/Export Prices Still in Deflation; Still Think the Fed Will Hike? --The Fed is struggling like mad to produce inflation, with little success on some fronts. Of course the Fed ignores asset bubbles in its measures. The Bloomberg Consensus range for export prices was 0.1%. The range for import prices was 0.4%. Economists were wildly off the mark on both estimates. Both prices declined. Export prices declined more than any economist's guess. Here are some Import/Export charts from the BLS.The Bloomberg Consensus Estimate for producer prices was 0.2%. Once again economists were wildly off the mark. The Producer Price Index came in at -0.4%, outside the range of any economist's prediction. The timeline for Fed hikes went from June to September to December. I did not think they would hike this year, and expectations are finally leaning that way. If the Fed does hike bond yields will spike. But when does the Fed disappoint the markets?
Dear Bureau Of Labor Statistics, About Those Plunging Gasoline Prices...One of the major reasons for yesterday's market surge to new record highs was the surprise drop and miss in the April wholesale inflation report, or rather make that deflation, when the BLS announced that PPI in April had dropped by 0.4%, far below expectation of a 0.1% increase, of which the BLS said "over 30 percent can be attributed to the index for gasoline, which decreased 4.7 percent." The implication, of course, being that with the US drifting ever further from the Fed's desired 2% inflation threshold, not only is the probability of a June rate hike negligible, but the last time US macro data was this bad, the Fed launched QE2 (and Operation Twist... and QE3). Which is all great, we just have one question for the BLS: just what "data" are you looking at? Because a quick reality check reveals April gasoline prices not only did not drop 4.7%, they rose by 8%! ... leading to the following grtesque divergence between "data" from the US Department of Truth and, well, the real world. And just to put it in perspective, at this rate in a few weeks gasoline prices in America's most auto-dependent state, California, will be at or above levels seen from last year. In fact, the surge in California gas prices in 2015 is the fastest on record.
How accurate are measures of inflation expectations - FRB St. Louis -- Modern theories posit that actual inflation depends importantly on expected inflation. But how accurate are measures of expected inflation? A recent Economic Synopses essay examined the accuracy of measures of long-term inflation expectations. Business Economist and Research Officer Kevin Kliesen noted that the current Monetary Policy Report to the Congress indicates that policymakers regularly examine several measures of inflation expectations, such as:
- Expectations of financial market participants
- Forecasts from staff economic models
- The consensus of professional forecasters
- Surveys of households and businesses
In his essay, Kliesen looked at a survey-based measure of expected inflation and a market-based measure:
- Survey-based: A monthly survey conducted by the University of Michigan Survey Research Center that asks consumers their expectations for consumer price index (CPI) inflation over the next five to 10 years
- Market-based: Also called the breakeven inflation rate, the difference between the nominal yield on U.S. Treasury securities and inflation-indexed Treasury securities of a comparable maturity1
These measures were compared to the compounded annual rate of growth in the CPI for the period five to 7.5 years later, as this horizon is assumed to be a reasonable approximation of the midpoint of the five- to 10-year horizon for the two measures of inflation expectations. Kliesen found that households routinely overestimated inflation and also assumed higher expected inflation than financial markets did for the entire period studied. The mean of the survey-based measure was 49 basis points higher than the market-based measure and more than 100 basis points higher than the actual rate of inflation.
Business inventories barely rise, suggest first quarter GDP contraction -- U.S. business inventories barely rose in March as sales recorded their biggest gain in eight months, the latest indication that the economy actually contracted in the first quarter. The Commerce Department said on Wednesday business inventories edged up 0.1 percent after a downwardly revised 0.2 percent gain in February. Economists polled by Reuters had forecast inventories rising 0.2 percent in March after a previously reported 0.3 percent increase in February. Inventories are a key component of gross domestic product. Retail inventories excluding autos, which go into the calculation of GDP, ticked up 0.1 percent in March. That was well below the 0.8 percent gain the government assumed in its advance estimate of first-quarter growth published last month. That was the latest suggestion that first-quarter GDP growth could be revised down from the scant 0.2 percent annual pace reported in April to show a contraction. Trade, wholesale and manufacturing inventory data published last week also came in weaker than the government's assumptions in the GDP snapshot. The government estimated that inventories added 0.74 percentage point to GDP growth in the first quarter. The economy was weighed down by a mix of bad weather, disruptions at ports, a strong dollar and deep spending cuts by energy firms. Retail inventories, excluding autos, rose 0.5 percent in February. In March, business sales increased 0.4 percent, the largest rise since last July, after falling 0.2 percent in February. At March's sales pace, it would take 1.36 months for businesses to clear shelves - a relatively high ratio that suggests limited scope for businesses to aggressively accumulate stocks. The ratio was down from 1.37 months in February.
Fed: Industrial Production decreased 0.3% in April -- From the Fed: Industrial production and Capacity Utilization Industrial production decreased 0.3 percent in April for its fifth consecutive monthly loss. Manufacturing output was unchanged in April after recording an upwardly revised gain of 0.3 percent in March. In April, the index for mining moved down 0.8 percent, its fourth consecutive monthly decrease; a sharp fall in oil and gas well drilling has more than accounted for the overall decline in mining this year. The output of utilities fell 1.3 percent in April. At 105.2 percent of its 2007 average, total industrial production in April was 1.9 percent above its year-earlier level. Capacity utilization for the industrial sector decreased 0.4 percentage point in April to 78.2 percent, a rate that is 1.9 percentage points below its long-run (1972–2014) average. This graph shows Capacity Utilization. This series is up 11.3 percentage points from the record low set in June 2009 (the series starts in 1967). Capacity utilization at 78.2% is 1.9% below the average from 1972 to 2012 and below the pre-recession level of 80.8% in December 2007. . The second graph shows industrial production since 1967. Industrial production decreased 0.3% in April to 105.2. This is 25.6% above the recession low, and 4.4% above the pre-recession peak. This was below expectations of no change, although March was revised up - and much of the decline over the last few months was due to the "a sharp fall in oil and gas well drilling".
US Industrial Production Slides For Fifth Straight Month In April - The case for a second-quarter revival in the US economy took another blow in today’s April report on industrial production. Output slumped 0.3% last month, marking the fifth-straight decline for the monthly comparison, the Federal Reserve reports. The annual pace continues to slide as well, with the year-over-year change dipping to 1.9% for the 12 months through April—the first reading below the 2% line in nearly three years. There’s clearly a deceleration in macro conditions unfolding and it’s no longer reasonable to argue that it was contained in Q1. It remains to be seen if the deceleration persists, but for the moment it’s obvious that industrial activity has downshifted considerably.The manufacturing sector is suffering too. Output among manufacturers, which represent about 75% of industrial activity, was flat last month. The no-change performance translates into a year-over-year gain of just 2.3%–the slowest annual rise since last July. Activity in mining and utilities also ramped down last month, and rather sharply, in part due to a downshift in oil and gas drilling, which has been nipped by the sharp slide in energy prices over the past year. Mining was off 0.8% in April as utilities retreated a hefty 1.3% last month, which follows March’s 5.4% dive.
Industrial Production, Down 5th Month, Weaker Than Economist Expectations - Industrial production came in at -0.3%, down for the fifth consecutive month below the Bloomberg Consensus Estimate. Industrial production is stalling, down 0.3 percent in April for a 5th straight monthly contraction. Factories are cutting back with capacity utilization down 4 tenths to 78.2 percent. And the manufacturing component, which has been flat to negative all year, is unchanged. All these readings are at or near the Econoday low-side forecasts.Among manufacturing subcomponents, consumer goods output fell 0.3 percent with business goods down 0.4 percent. Construction supplies rose only fractionally but at 0.1 percent the reading is the best all year (this a reminder of how weak construction and housing has been). A positive is a second strong month for auto output, up 1.3 percent on top of March's 4.3 percent surge, but whether output increases further will depend on auto sales which, in yesterday's retail sales report, turned lower in April. The two other main components in today's report show even greater weakness with mining, hurt by oil & gas, at minus 0.8 percent for the 6th contraction in 7 months and utilities at minus 1.3 percent for a 2nd straight decline. The industrial economy remains flat and is holding down what is supposed to be the economy's springtime bounce. The news from the factory sector, including this morning's Empire State report, won't be pulling forward expectations for the Fed's first rate hike.
US Industrial Production Weakens For 5th Month - Longest Streak Since Great Recession - On the heels of the weakest print since May 2009 in March, April Industrial Production printed -0.3% (against expectations of a bounce to -0.03% from -0.64% - which was revised higher).This is the 5th monthly drop in a row - the longest streak since the Great Recession. This is the 2nd weakest YoY print, at a mere +1.93%, since Feb 2010. To add to the pain, Capacity Utlization missed expectations falling to its lowest since Jan 2014 (falling the most YoY since Dec 2009) and Manufacturing production was unchanged.
US industrial output falls for 5th month on lower drilling - A plunge in energy-related drilling and sluggish manufacturing sent U.S. industrial output down for a fifth straight month in April. Overall industrial production slid 0.3 percent in April after a drop of the same size in March, the Federal Reserve said Friday. The figures suggest that weakness in manufacturing and mining is weighing heavily on the economy. Oil and gas well drilling activity plunged 14.5 percent last month, its fourth straight double-digit decline. Last year’s steep decline in oil prices, from about $110 a barrel to $50 in January, has forced energy firms to rapidly scale back operations. Manufacturing output was unchanged after rising 0.3 percent in March. Utility production fell 1.3 percent, as Americans used less heat but haven’t yet cranked up the air conditioning. The cutbacks by energy companies likely contributed to a drop in the production of industrial machinery, which fell 0.9 percent, its second straight decline. The strong dollar also likely held back machinery sales, because it makes goods more expensive overseas. Companies like Caterpillar are exporting fewer trucks, bulldozers and other industrial machines. In the first three months of the year, industrial production fell at a 0.7 percent annual rate, the worst quarterly showing since the second quarter of 2009 when the economy was mired in recession. Manufacturing output also fell 1 percent in the first quarter. In addition to less drilling by energy firms, the sharp fall in new wells has led to weaker demand for steel pipe and other manufactured goods such as rail cars and transport oil. Those factors contributed to a very weak showing for the economy in the first three months of the year, when most analysts expect that it contracted by as much as 1 percent at an annual rate.
What's killing steel?: Ever since January, US steel production has turned seriously south, down over -10% YoY in most weekly reports. What's killing steel? One graph from the Iron and Steel Institute is worth 1000 words: This week the analysis was updated through April: "[S]teel import permit applications for the month of April total 3,294,000 net tons (NT). This was a 12% decrease from the 3,761,000 permit tons recorded in March and a 9% decrease from the March final imports total of 3,616,000 NT. Import permit tonnage for finished steel in April was 2,761,000, down 13% from the final imports total of 3,186,000 in March. For the first four months of 2015 (including April SIMA and March final), total and finished steel imports were 15,015,000 NT and 12,428,000 NT, respectively, up 12% and 26% from the same period in 2014. The estimated finished steel import market share in April was 31% and is 33% year-to-date (YTD). ".... ".... Through the first four months of 2015, the largest offshore suppliers were South Korea (2,338,000 NT, up 49% from the same period in 2014), Turkey (1,178,000 NT, up 93%) and China (983,000, up 1%)."
The strong dollar is hurting U.S. manufacturing. There’s a lesson in there for the TPP. - - Jared Bernstein and Dean Baker -- In a recent reversal of a positive trend, the nation’s factories have added almost no jobs on net over the past three months. Employment in the factory sector grew by more than 200,000 jobs last year, but in the past three months, it’s up only 4,000. The number of total hours worked in the job market is also down over these past few months by half a percent, the equivalent of a loss of 60,000 jobs. This slowdown could be a blip — a few months does not a new trend make. But we doubt it, because there is a good explanation for the change: the sharp increase in value of the U.S. dollar in foreign markets. When the value of the dollar increases, it means that a dollar is worth more in terms of foreign currencies. A year ago, it cost about $1.40 to buy one euro; today, because the dollar has gained strength, it costs $1.12. That’s a sweet deal if you’re an American in Paris. But it’s a tough deal if you’re an American exporter, because it means our exports cost more in foreign currencies and imports from abroad are cheaper here. Although this data is also noisy, the U.S. trade deficit in manufactured goods has increased by more than $100 billion between the first quarter of 2014 and the first quarter of 2015. Therein lies the connection to the flattening trend of manufacturing jobs, a connection that has been widely recognized in recent economic commentary. As Politico put it, “The rising dollar — lifted by stronger U.S. growth and weakness in Europe and elsewhere — makes domestic products more expensive abroad and limits the need for U.S. manufacturers to hire more workers to make more products.” Meanwhile, as these dynamics have been unfolding in international markets, the White House is busy selling a trade agreement — the Trans-Pacific Partnership — that it says will take down trade barriers and boost American exports. Yet the TPP contains no currency provisions, meaning there are no enforceable rules in the deal that would prevent our trading partners from managing their currency so that it stays low relative to the dollar, invoking similar dynamics to those just described.
Empire State Manufacturing Conditions "Improved Slightly" - This morning we got the latest Empire State Manufacturing Survey. The diffusion index for General Business Conditions at 3.1 (3.09 to two decimals) shows an increase from last month's -1.2, which signals a return to modest improvement in activity. The Investing.com forecast was for a reading of 5.0. The Empire State Manufacturing Index rates the relative level of general business conditions in New York state. A level above 0.0 indicates improving conditions, below indicates worsening conditions. The reading is compiled from a survey of about 200 manufacturers in New York state. Here is the opening paragraph from the report.The May 2015 Empire State Manufacturing Survey indicates that business conditions improved slightly for New York manufacturers. The headline general business conditions index climbed four points to 3.1. The new orders index rose ten points to 3.9, and the shipments index was little changed at 14.9. Labor market indicators pointed to a small increase in employment levels but a slight decline in the average workweek. The prices paid index fell ten points to 9.4, its lowest level in nearly three years, and the prices received index edged down to 1.0, indicating that selling prices were flat. The index for future general business conditions fell noticeably, reflecting a positive but less favorable outlook than in April. Here is a chart illustrating both the General Business Conditions and Future General Business Conditions (the outlook six months ahead):
Empire State Manufacturing Weaker Than Economists' Expectations - The Empire State Manufacturing survey came in today weaker than the Bloomberg Consensus Estimate, but at least the economists got the leading +- sign correct. The first indication on May conditions in the manufacturing sector is soft, as indications have been all year. The Empire State index came in at 3.09, below what were already weak Econoday expectations for 5.00. Shipments look respectable at 14.94 but are way ahead of new orders, at only 3.85, and even further ahead of backlog orders which are in deep contraction at minus 11.46. Employment growth is down as is the 6-month outlook, both pointing to a lack of optimism. Price readings in this report stand out, pointing to even less pressure than in April with input cost inflation very subdued, down nearly 10 points to 9.38, and with virtually no price traction at all for finished goods, at only 1.04. The manufacturing sector, hurt in part by weak exports, looks to be more and more of a drag at a time when economic growth is supposed to be on a springtime rebound.
Empire Manufacturing Misses For 4th Month In A Row As Spending Outlook Plunges To 15-Month Lows - Having plumbed the depth of 2-year lows in April, May's Empire Manufacturing printed a disappointing 3.09 (against expectations of a bounce to 5.00 from -1.19). This is the 4th miss in a row and for context is the same level as we dropped to in January 2008. Number of employees and prices paid (and received) tumbled, new orders edged higher but crucially 'hope' plunged back to 3-month lows. Furtures expectations for CapEx and Tech Spending also collapsed. The May general business conditions index advanced four points but, at 3.1, indicated that business conditions were only slightly better over the month. 30% of respondents reported that conditions had improved, while 27% reported that conditions had worsened. Tech Spending expectations at 15 month lows... the biggest MoM decline since Nov 2008.
Muskular Magic -- Kunstler -- Elon Musk, Silicon Valley’s poster-boy genius replacement for the late Steve Jobs, rolled out his PowerWall battery last week with Star Wars style fanfare, doing his bit to promote and support the delusional thinking that grips a nation unable to escape the toils of techno-grandiosity. The main delusion: that we can “solve” the problems of techno-industrial society with more and better technology. The South African born-and-raised Musk is surely better known for founding Tesla Motors, maker of the snazzy all-electric car. The denizens of Silicon Valley are crazy about the Tesla. There is no greater status trinket in Northern California, where the fog of delusion cloaks the road to the future. They believe, as Musk himself often avers, that Tesla cars “don’t burn hydrocarbons.” That statement is absurd, of course, and Musk, who holds a degree in physics from Penn, must blush when he says that. After all, you have to plug it in and charge somewhere from the US electric grid. Only 6 percent of US electric power comes from “clean” hydro generation. Another 20 percent is nuclear. The rest is coal (48 percent) and natural gas (21 percent) with the remaining sliver coming from “renewables” and oil. (The quote marks on “renewables” are there to remind you that they probably can’t be manufactured without the support of a fossil fuel economy). Anyway, my point is that the bulk of US electricity comes from burning hydrocarbons, and then there is the nuclear part which is glossed over because the techno-geniuses and politicians of America have no idea how they are going to de-commission our aging plants, and no idea how to safely dispose of the spent fuel rod inventory simply lying around in collection pools. This stuff is capable of poisoning the entire planet and we know it. The PowerWall roll out highlighted the “affordability” of the sleek lithium battery at $3,500 per unit. The average cluck watching Musk’s TED-like performance on the web was supposed to think he could power his home with it. Musk left out a few things. Such as: you need the rooftop solar array to feed the battery. Figure Also consider that you need a charge controller and inverter to manage the electric flow and convert direct current (DC) from the sun into usable alternating current (AC) for your house — another $3,500. So, the cost of hanging a solar electric system on your house with all its parts is more like fifty grand. What happens when the solar panels, battery, etc., reach the end of their useful lives, say 25 years or so, when there is no more fossil fuel (or an industry capable of providing it economically). How will you fabricate the replacement parts? By then the techno-wizards will have supposedly “come up with” a magic energy rescue remedy. Stand by on that, and consider the possibility that you will be disappointed with how it works out.
Google acknowledges 11 accidents with its self-driving cars - Google Inc. revealed Monday that its self-driving cars have been in 11 minor traffic accidents since it began experimenting with the technology six years ago.The company released the number after The Associated Press reported that Google had notified California of three collisions involving its self-driving cars since September, when reporting all accidents became a legal requirement as part of the permits for the tests on public roads. The director of Google's self-driving car project wrote in a web post that all 11 accidents were minor — "light damage, no injuries" — and happened over 1.7 million miles of testing, including nearly 1 million miles in self-driving mode. "Not once was the self-driving car the cause of the accident," wrote Google's Chris Urmson. "Cause" is a key word: Like Delphi Automotive, a parts supplier which suffered an accident in October with one of its two test cars, Google says it was not at fault. Delphi sent AP an accident report showing its car was hit, but Google has not made public any records, so both enthusiasts and critics of the emerging technology have only the company's word on what happened. The California Department of Motor Vehicles said it could not release details from accident reports. This lack of transparency troubles critics who want the public to be able to monitor the rollout of a technology that its own developers acknowledge remains imperfect.
Still On a Road to Nowhere -- A short road too often traveled. Federal highway funding is due to expire in about two weeks, and Transportation Secretary Anthony Foxx says a temporary extension—the 33rd in six years—would “prolong a dangerous status quo of funding infrastructure at a level that has left our transportation system gasping for air.” But Congress is almost certain to do it anyway. Maybe a gas tax increase is no political dead end. According to an analysis by the American Road & Transportation Builders Association, 95 percent of Republican state lawmakers and 88 percent of Democrats who voted for gas tax increases in 2013 and 2014 were re-elected. Thus, ARTBA concludes that members of Congress have nothing to fear should they vote to give the Federal Highway Trust Fund a boost by raising the federal gasoline tax. Lawmakers don’t seem to be buying the story.
NFIB: Small Business Optimism Index increased in April - From the National Federation of Independent Business (NFIB): Small Business Optimism Rises, But Future Sales Cloud Outlook The Small Business Optimism Index increased 1.7 points from March to 96.9, this in spite of a quarter of virtually no economic growth. Unfortunately, the Index remained below the January reading. Nine of the 10 Index components gained, only real sales expectations were weaker. But this still leaves the Index below its historical average, oscillating between 95 and 98 but never breaking out except for December, when the Index just tipped past 100, only to fall again....Small businesses posted another decent month of job creation. Those that hired were more aggressive than those reducing employment, producing an average increase of 0.14 workers per firm, continuing a string of solid readings for 2015. ... Twenty-seven percent of all owners reported job openings they could not fill in the current period, up 3 points from March. A net 11 percent plan to create new jobs, up 1 point and a solid reading. More good news: Only 11 percent of companies reported "poor sales" as the most important problem, down from 16% a year ago, and a recession high of 34%.This graph shows the small business optimism index since 1986. The index increased to 96.9 in April from 95.2 in March.
Small-Business Owners Were More Upbeat and Ready to Hire in April - Confidence among small-business owners increased in April after a March drop, according to a report released Tuesday. Hiring activity also picked up, although many owners said they could not find qualified workers. The National Federation of Independent Business‘s small-business optimism index increased to 96.9 in April, up from 95.2 in March but below the 98.0 posted in February. Economists surveyed by The Wall Street Journal projected the index to increase but only to 96.1. Of the 10 subindexes, nine increased last month. The most positive news came from the labor front. The NFIB said in the three months ended in April, small businesses hired, on average, 0.14 workers per firm, “continuing a string of solid readings for 2015″ the trade group said. Despite the addition of so many new workers already, hiring plans remain upbeat. The subindex covering plans to create new jobs increased 1 percentage point to 11% in April. Small firms continue to face a shortage of certain skilled workers. The subindex covering jobs that are hard to fill increased to 27% in April from 24%. So far in 2015, the rate has averaged 26.5%, above the 23.7% average of 2014. Of those looking for workers, 83% said they were seeing few or no applicants who were qualified for the open positions. The capital outlays subindex increased 2 points to 26%. Interestingly, the NFIB said the states with shale oil operations exhibited stronger capital spending and hiring than the rest of the states “though firms in these states were more pessimistic about future business conditions, likely a result of the collapse of oil and gas activity.” The only blemish in the April survey was a drop in sales expectations among small-business owners. That index declined 3 points to 10%. Business conditions expectations edged up 1 point to minus 6%.
April Employment…Not Bad « U.S. Economic Snapshot: (11 graphs) Today’s employment report for April from the BLS showed a solid gain in employment +223,000. However, a downward revision of -41,000 leaves March at a disappointing 85,000 with one more revision to go. Probably the best thing about the report is that it was not bad. The numbers roughly hit the consensus forecast of 230,000. But the recent performance underscore how noisy this estimate is. Nevertheless, the numbers signal an economy that is growing slowly, but definitely growing in spite of many challenges in the global environment. The gains, however, were pretty much across the board, although, mining and logging saw a third straight month of decline as the oil industry continues to struggle with the low oil prices. There has been a slight uptick in those prices of late. Average hours of work have remained pretty flat over the last few months, around 34.5. Nominal earnings growth remains flat, but in real terms, labor income is up. On the household side of the ledger, there was a fairly restrained increase in employment, 166,000. The unemployment rate declined slightly to 5.4%…that is from 0.05465056 to 0.05442727. And the long term unemployed (27 weeks and over) fell slightly but remains elevated, obviously a concern as these workers may lose skills and become even more difficult to hire. The employment to population ratio is also quite sluggish…stuck at 59.3% since February. The other slightly negative news is that productivity declined for the second straight month…it is the first time this has happened since 2006! Putting this together, it appears as if the good news is that it wasn’t bad news…meaning that it does not appear that it will change anyone’s view of when the Fed will begin liftoff. Many commentators have feared that future revisions of Q1 GDP could show that it actually shrank. These number do not seem consistent with that, although as noted above, they could be revised downward as well.
April Unemployment Stats Look Solid for Real Employment Growth - The April unemployment rate remained the same, yet unlike the past few months, the lack of change was not due to people dropping out of the workforce. Instead the participation rate ticked up a smidgen and more people were considered employed. The official unemployment rate is 5.4%, a tenth of a percentage point lower than last month. The labor participation rate ticked up a tenth of a percentage point and is now 62.8%, although the employment to population ratio didn't budge from last month. This article overviews and graphs the statistics from the Employment report Household Survey also known as CPS, or current population survey. The CPS survey tells us about people employed, not employed, looking for work and not counted at all. The household survey has large swings on a monthly basis as well as a large margin of sampling error. The CPS has severe limitations, yet, it is our only real insight into what the overall population are doing for work. Those employed grew by 192,000 this month, a fine showing in comparison to the last few monthly changes. From a year ago, the employed has increased by 2.8 million, well beyond what is needed to keep up with increased population growth. Those unemployed decreased by -26,000 to stand at 8,549,000. From a year ago the unemployed has decreased by -1.15 million. Below is the month change in unemployed and as we can see, this number normally swings wildly on a month to month basis. Those not in the labor force increased by 19,000 to 93,194,000. The below graph is the monthly change of the not in the labor force ranks. Those not in the labor force has increased by 1,175,000 in the past year. The labor participation rate is at 62.8%, a 0.1 change from last month and a rebound to February's rate. Those aged 16 and over either working or looking for work is still at record lows, as shown in the below graph. The low labor participation rate is not all baby boomers and people entering into retirement. Below is a graph of the labor participation rate for those between the ages of 25 to 54. These are the prime working years, so one cannot blame retirement and college on the declining participation rate. The 25 to 54 age bracket labor participation rates have not been this low since the 1980's recession and the rate stands at 81%, the same rate as February.
More Employment Graphs: Duration of Unemployment, Unemployment by Education, Construction Employment and Diffusion Indexes -- By request, a few more employment graphs ... This graph shows the duration of unemployment as a percent of the civilian labor force. The graph shows the number of unemployed in four categories: less than 5 week, 6 to 14 weeks, 15 to 26 weeks, and 27 weeks or more. The general trend is down for all categories, and the "less than 5 weeks", "6 to 14 weeks" and "15 to 26 weeks" are all close to normal levels. The long term unemployed is less than 1.6% of the labor force - the lowest since November 2008 - however the number (and percent) of long term unemployed remains elevated.This graph shows the unemployment rate by four levels of education (all groups are 25 years and older). Clearly education matters with regards to the unemployment rate - and it appears all four groups are generally trending down. Although education matters for the unemployment rate, it doesn't appear to matter as far as finding new employment. Note: This says nothing about the quality of jobs - as an example, a college graduate working at minimum wage would be considered "employed". This graph shows total construction employment as reported by the BLS (not just residential). Since construction employment bottomed in January 2011, construction payrolls have increased by 951 thousand. Construction employment is still far below the bubble peak - and below the level in the late '90s.The BLS diffusion index for total private employment was at 57.0 in April, down from 59.5 in March. For manufacturing, the diffusion index was at 50.6, up from 45.6 in March. Think of this as a measure of how widespread job gains are across industries. The further from 50 (above or below), the more widespread the job losses or gains reported by the BLS. Above 60 is very good.
The Fed’s Labor Market Conditions Index Close To 3-Year Low - US payrolls bounced back in April, rising a solid 223,000 after March’s dismal gain of just 85,000. The news cheered the crowd and renewed faith in the case for macro optimism. But if the second-quarter is on the path of recovery after a rough winter, it’s not obvious in the Federal Reserve’s 19-factor Labor Market Conditions Index (LMCI), which ticked lower again in April and posted its second-consecutive negative reading. LMCI, which is designed to capture the broad trend in the labor market based on a wide spectrum of data, slipped to -1.9 last month, the lowest level in nearly three years. Is this a sign that the labor market is weaker than the April bounce-back in payrolls implies? History shows that the monthly percentage changes in payrolls tend to track LMCI’s monthly fluctuations relatively closely, but not always. As one example, based on revised data, LMCI held steady at a comparatively elevated level in December while the monthly increase in payrolls decelerated substantially. Soon after, LMCI reflected the slowdown in the labor market. Is the latest weakness in LMCI another case of a delayed reaction to a change in the labor market? It wouldn’t be the first time. One reason for thinking that LMCI will perk up comes via the Conference Board’s Employment Trends Index (ETI), which aggregates eight labor market indicators.ETI inched up to a new post-recession high last month. Conference Board spokesman Gad Levanon said in a press release that: April’s bounceback in the Employment Trends Index is somewhat reassuring, but expectations remain that job growth will be slower this year compared with last year. Given that the labor force is barely expanding, job growth of about 200,000 per month will be sufficient to continue rapidly lowering the unemployment rate.
U.S. Job Openings Slide As Hires, Separations Rise - The number of job openings in the U.S. fell from a 14-year high in March, while the number of Americans getting hired and leaving jobs increased. Job openings slid to just under five million in March, down from 5.1 million in February. The number of Americans actually hired to fill jobs ticked up to nearly 5.1 million in March, compared with five million in February, according to the Labor Department’s Job Openings and Labor Turnover Survey, known as Jolts. The primary jobs report shows the net change in jobs. Employers added 223,000 jobs in April, a welcome rebound after March’s gain of only 85,000, the worst monthly performance in almost three years. The Jolts report, which is only available through March, tracks the millions of Americans each month who quit a job, are laid off or start a new job. The latest details on hiring suggest more churn in the labor market as employers continued to add jobs, but more Americans also left their jobs. The total number of separations approached five million in March, compared with 4.8 million in February. The report is closely followed by officials at the Federal Reserve. Chairwoman Janet Yellen has said the rate of voluntary quitting as a key gauge of worker’s confidence in the economy. When the economy is stronger, workers are more likely to quit their job due to the greater ease of finding something different. The number of voluntary quits inched ahead in March, rising to 2.8 million from 2.7 million in February. Layoffs also increased, hitting nearly 1.8 million compared with 1.7 million a month earlier. The Labor Department report highlighted an increase in the mining industry, which includes the oil and gas industry.
BLS: Jobs Openings at 5.0 million in March, Up 19% Year-over-year - From the BLS: Job Openings and Labor Turnover Summary There were 5.0 million job openings on the last business day of March, little changed from 5.1 million in February, the U.S. Bureau of Labor Statistics reported today. Hires were little changed at 5.1 million in March and separations were little changed at 5.0 million....Quits are generally voluntary separations initiated by the employee. Therefore, the quits rate can serve as a measure of workers’ willingness or ability to leave jobs. ... There were 2.8 million quits in March, little changed from February. The following graph shows job openings (yellow line), hires (dark blue), Layoff, Discharges and other (red column), and Quits (light blue column) from the JOLTS. Note: The difference between JOLTS hires and separations is similar to the CES (payroll survey) net jobs headline numbers. This report is for March, the most recent employment report was for April. Note that hires (dark blue) and total separations (red and light blue columns stacked) are pretty close each month. This is a measure of labor market turnover. When the blue line is above the two stacked columns, the economy is adding net jobs - when it is below the columns, the economy is losing jobs. Jobs openings decreased in March to 4.994 million from 5.144 million in February. The number of job openings (yellow) are up 19% year-over-year compared to March 2014. Quits are up 14% year-over-year. These are voluntary separations. (see light blue columns at bottom of graph for trend for "quits").
JOLTS Data Suggest a Sideways-Moving Economy - This morning’s Job Openings and Labor Turnover Survey (JOLTS) report rounds out the employment situation for March. Last week, we saw substantial downward revisions to payroll employment, revisions that exposed one of the slowest job gains in recent years. The job openings data reveal the same story: the recovery may be slowing. That said, April job growth was considerably stronger, but taking into account the most recent three month job-growth average, the economy won’t resemble the strength of the pre-recession economy (such as it was) until August 2017. The total number of job openings fell slightly to 5.0 million in March and the number of unemployed workers fell slightly to 8.6 million. Taken together, the result was a job-seekers-to-job-openings ratio that held steady at 1.7. This ratio has been declining steadily from its high of 6.8-to-1 in July 2009, as shown in the figure below. As with the top line job openings number, the hires, quits, and layoff rates held steady in the March JOLTS report. As you can see in the figure below, layoffs shot up during the recession but recovered quickly and have been at pre-recession levels for more than three years. The fact that this trend continued in March is a good sign. That said, not only do layoffs need to come down before we see a full recovery in the labor market, but hiring also needs to pick up—the hires rate was unchanged in March. It has been generally improving, but it still remains below its pre-recession level.
JOLTS Shows Good News for Labor a Long Time Comin' -- Lately labor statistics are looking more and more like a return to normal. The depth of the recession has been so prolonged, to see any real positives for the U.S. workforce seems like a fantasy dream. Yet, the dream is becoming real, or so says the BLS JOLTS report. Jobs are finally coming back. The Job Openings and Labor Turnover Survey shows there are 1.72 official unemployed per job opening for March 2015. Job openings were around five million. Job openings returned to pre-recession levels while overall hires are finally approaching pre-recession levels. In just the private sector job openings have also recovered to be at pre-recession levels while private hires are 2.4% from their pre-recession levels. The U.S. is finally returning full circle to 2007 while eight years have passed and population has expanded. There were 1.8 official unemployed persons per job opening at the start of the recession, December 2007. Below is the graph of the official unemployed per job opening, currently at 1.7 people per opening. Finally the U.S. returns to having enough job openings after years of terrible figures. If one takes the U-6 broader measure of unemployment that includes people who are forced into part-time work and the marginally attached, the ratio is 3.5 people needing a job to each actual job opening. In December 2007 this ratio was 3.2. So here too we're finally seeing some good ratios regarding job openings. By either measure it is clear job openings have finally returned to pre-recession levels. Yet population increases, so having raw numbers come up to levels from eight years ago and so many stopped looking for work belies the level and ratios. Currently job openings stand at 4,994,000.
Full steam ahead on 3 cylinders -- JOLTS data continues to look strong. Growth in the major categories continues to be strong (the slopes of the weighted moving averages), and the rates are basically at full employment levels. Because a labor force that skews older will have lower turnover, hires and quits are topping out slightly lower than in the previous recovery and job openings are slightly higher. It would be tempting to blame this on structural issues (read: my political hobby horses), but these small changes in rates are about where a back-of-the-envelope estimate of demographic effects would suggest. Older workers, in aggregate, have much lower unemployment rates and much longer unemployment duration, which means dramatically lower employment churn.But, the New York Fed's Household Debt and Credit Report showed no growth in housing debt still in the first quarter, in spite of some signs that mortgages have begun to grow. Until mortgages show sustained growth, annual growth in bank credit probably will be limited to less than 10%. If that is where we stay, it seems like we could have decent GDP growth. I suspect that non-shelter inflation will remain tame if that is the case, but I am not sure about that. I don't see how long term interest rates would be able to rise in that scenario, though. It's strange that FOMC members still talk about low interest rates as if they are stimulative, when clearly the asset class that is unable to gain traction is housing and clearly interest rates are not the constraining factor there. I am afraid that if mortgages don't move, long term interest rates will collapse, and the Fed will interpret that as stimulative, giving them more confidence about raising interest rates on reserves. What a strange economy this is. Housing, education and health care have been eating up our productive capacity for some time. The details differ for each sector, but each is giving us a declining share of real output while we keep spending the same or more.
Weekly Initial Unemployment Claims decreased to 264,000, Lowest 4-Week average in 15 years - The DOL reported: In the week ending May 9, the advance figure for seasonally adjusted initial claims was 264,000, a decrease of 1,000 from the previous week's unrevised level of 265,000. The 4-week moving average was 271,750, a decrease of 7,750 from the previous week's unrevised average of 279,500. This is the lowest level for this average since April 22, 2000 when it was 266,750. There were no special factors impacting this week's initial claims. The previous week was unrevised. The following graph shows the 4-week moving average of weekly claims since January 2000.
Jobless Claims Collapse Near 42 Year Low, But Texas Turmoils -- Only once in the last 42 years have jobless claims been lower than this week's 264k print... Other than April 2000, this is the 'best' jobless claims print since 1973! But not everyone is loving it as Texas continues to turmoil (no matter how diversified the talking heads tell the people their economy is). But Texas remains in trouble... "As Good As It Gets?" Charts: Bloomberg
Weekly Initial Unemployment Claims as a Percent of Labor Force: Earlier I mentioned that the 4-week moving average of weekly claims was the lowest since April 2000. And if the average falls just a little further, the average will be the lowest in over 40 years. Of course that doesn't take into account the size of the labor force. The following graph shows the 4-week moving average of weekly claims since 1967 as a percent of the labor force. As a percent of the labor force, weekly claims are at an all time record low. Note: There is a general downward slope to weekly claims - interrupted by periods of recession. The downward slope is probably related to changes in hiring practices - such as background checks and drug tests, and maybe better planning.
Faster Real GDP Growth during Recoveries Tends To Be Associated with Growth of Jobs in “Low-Paying” Industries - St. Louis Fed --Typically, deep recessions are followed by rapid growth. However, since the second quarter of 2009, when the latest recession officially ended, real (inflation-adjusted) gross domestic product (GDP) has increased at only a 2.3 percent annual rate.1 Prior to the latest recession, the economy's long-term growth rate of real potential GDP was about 3 percent per year.2 Thus, the current business expansion could not only be the weakest on record—although that conclusion will ultimately depend on its length and future growth—but it could signal a worrisome downshift in the economy's long-term growth rate of real potential GDP. A common refrain among many economic pundits and analysts is that the bulk of the job gains during this recovery have been in "low-wage jobs," a term that is rarely defined. This essay will explicitly define "low-wage" jobs in order to assess the validity of this claim. To preview our conclusion, we found that the percentage change in job losses during the latest recession was higher in "high-paying" private-sector industries—which we define as industries with above-average hourly earnings—than in low-paying sectors. Likewise, the percentage change in job gains during the recovery was also proportionately larger in high-paying industries. It should be pointed out, though, that the total number of jobs in low-paying industries exceeds the number of jobs in high-paying industries by nearly 70 percent. Thus, an equal percentage increase in jobs in both industries would generate much larger job gains in low-paying industries than in high-paying industries. We also found that the percentage change in job gains in low-paying industries was much stronger following the 1981-82 and 1990-91 recessions, which also happened to be periods of much stronger real GDP growth.
The Numbers Needed for the Prime U.S. Workforce to Recover - At last year's Jackson Hole Symposium, Fed Chair Janet Yellen delivered an extended analysis of "Labor Market Dynamics and Monetary Policy". Her speech essentially reviewed the ongoing debate over the mix of cyclical versus structural factors in employment since the Great Recession. Here is an updated a series of charts illustrating some structural changes in the workforce that are far more significant than the cyclical impact of the Great Recession. The closely watched headline unemployment rate is a calculation of the percentage of the Civilian Labor Force, age 16 and older, currently unemployed. Let's put that into its historical context. The first chart below illustrates this monthly data point since 1990. The indicator for April ticked down from 5.5% to 5.4%. Today's Civilian Employed would require 1.6 million additional job holders to match its interim low in 2007, and we would need 2.5 million to match the lowest rate in 2000. Let's look at the same statistic for the core workforce, ages 25-54. This cohort leaves out the employment volatility of the college years, the lower employment of the retirement years and also the age 55-64 decade when many in the workforce begin transitioning to retirement. In the latest data this indicator ticked up from 4.5% to 4.6%. Today's age 25-54 labor force would require the additional employment of 1.2 million age 25-54 to match its interim low in 2006 and 1.7 million to match the lowest rate in 2000. A wildcard in the two snapshots above is the volatility of the Civilian Labor Force -- most notably the subset of people who move in and out of the workforce for various reasons, not least of which is discouragement during business cycle downturns. The chart below continues to focus on our 25-54 core cohort with a broader measure: The Labor Force Participation Rate (LFPR). The LFPR is calculated as the Civilian Labor Force divided by the Civilian Noninstitutional Population (i.e., not in the military or institutionalized). Because of the extreme volatility of the metric, we've included a 12-month moving average. Based on the moving average, today's age 25-54 cohort would require 2.8 million additional people in the labor force to match its interim peak participation rate in 2008 and 4.1 million to match the peak rate around the turn of the century.
‘Rise of the Robots’ and ‘Shadow Work’ -- In the late 20th century, while the blue-collar working class gave way to the forces of globalization and automation, the educated elite looked on with benign condescension. Too bad for those people whose jobs were mindless enough to be taken over by third world teenagers or, more humiliatingly, machines. The solution, pretty much agreed upon across the political spectrum, was education. Americans had to become intellectually nimble enough to keep ahead of the job-destroying trends unleashed by technology, both robotization and the telecommunication systems that make outsourcing possible. Anyone who wanted a spot in the middle class would have to possess a college degree — as well as flexibility, creativity and a continually upgraded skill set. But, as Martin Ford documents in “Rise of the Robots,” the job-eating maw of technology now threatens even the nimblest and most expensively educated. Lawyers, radiologists and software designers, among others, have seen their work evaporate to India or China. Tasks that would seem to require a distinctively human capacity for nuance are increasingly assigned to algorithms, like the ones currently being introduced to grade essays on college exams. Particularly terrifying to me, computer programs can now write clear, publishable articles, and, as Ford reports, Wired magazine quotes an expert’s prediction that within about a decade 90 percent of news articles will be computer-generated.
How we’ve all been duped into subsidizing our employers -- Paul Donovan, economist at UBS, is perplexed by cyclically abnormal levels of capital spending relative to borrowing costs in key western economies. All the more so given that the sluggish capital spending story is also being accompanied by a significant increase in the number of businesses. Since these two facts don’t logically tally up, what exactly is going on? One point to consider, Donovan notes on Tuesday, is that capital spending by and large is associated with replacement investment. For new businesses this usually takes the form of start-up capital spending instead. So why aren’t new businesses spending as much on capex as might otherwise be expected? Part of the answer, according Donovan, could lie in both technological and labour trends — notably the rise of the self-employed individual and his propensity to deploy existing private capital for business purposes. As Donovan notes: It is evident that as spending on technology waned in the corporate sector it continued to grow in the consumer sector. This is not just a technology story, of course. The drift towards selfemployment and changing working habits may promote changes in office use, transport equipment, office furniture and so on. We don’t have to go to the hipster extreme of working from a coffee shop for this to be true. What this means is that investors looking for a “capex recovery” may be missing the point. The secret capex story may be that businesses make better use of nonbusiness assets, and that part of the capex cycle (including replacement capex) masquerades under a “retail sales” pseudonym in the future. As an example, Donovan emphasises that he himself wrote the above report on a personal laptop computer which he bought, not UBS.
No: Rich People Don’t Work More --The meme is ubiquitous, and widely documented: Rich people work longer hours. Obvious implication: they deserve what they get, right? Ditto the poor. Bunk.Why? All the research supporting that meme looks at workers, not families. It completely ignores students, the retired, and anyone else who isn’t working. Alert the media: workers work more than non-workers. And, news flash: rich families are full of non-workers. If you look at families and their hours worked per person, you see a very different picture: Here’s the same 3+ household data for working-age families only: those with a head of household under age 65. Pretty much the same story.This is all based on a fast-and-dirty random census pull of about 5,000 U. S. households, from IPUMS. It uses 3+ households as a proxy for families — probably not a bad proxy. A professional economist doing proper due diligence would fine-tune that, or even better turn to the Panel Study of Income Dynamics (PSID), which has better microdata to track families. Careful work would even allow them to track extended, multi-generation families, not just nuclear families living together. (Think: dynasties.) I’d expect the pattern we see here to be more pronounced in that view (though that’s just a surmise).
American Meritocracy Isn’t What It Used To Be, In Five Charts -- Last week’s WSJ/NBC poll found that Americans, by more than two to one, are more worried about their ability to get ahead financially than they are about the widening income gap. A new book by Robert Putnam, the Harvard University political scientist, delivers some detailed insights into what’s behind those worries. Mr. Putnam joins President Barack Obama and Arthur Brooks, president of the American Enterprise Institute, for a discussion on poverty at Georgetown University on Tuesday. Mr. Putnam drew attention to the growing segregation of America along class lines at a conference hosted last month by the Federal Reserve on economic mobility in which he outlined key themes from the book, “Our Kids: The American Dream in Crisis.” Even as Americans have become less segregated across racial and religious lines than they were a generation ago, they have grown more segregated along class lines. Americans are much less likely to go to school, live with, or marry people from different socioeconomic backgrounds, Mr. Putnam said. “More and more young people aren’t meeting across class lines,” said Mr. Putnam, raising troubling questions about the implications for the next generation of Americans. Here’s a look at some of the evidence Mr. Putnam brings to support his concerns about the yawning “opportunity gap” in American society.
We need to make it easier for US workers to get to where the good jobs are -- The jobless rate is falling faster in Decatur, Ill. — an aging industrial city south of Chicago — than almost anywhere else in America. More than three percentage points in the past year. But look closer, as Wall Street Journal reporters Mark Peters and Ben Leubsdorf do, “and this city of 75,000 resembles many communities across the industrial Midwest, where the unemployment rate is falling fast in part because workers are disappearing: moving away, retiring or no longer looking for a job.” The relocation issue is particularly interesting. The piece tells the story of a laid-off Caterpillar worker, Denny Ryder, who left Decatur last year for Winston-Salem, N.C. He found work at a Caterpillar contractor: Bad for Decator, perhaps, but good for this individual worker. The ability to relocate and find work is a positive aspect for any economy, and there should be more of it in this one. AEI’s Michael Strain recommends that US unemployment programs should include a relocation subsidy: A program like this already exists under the Trade Adjustment Assistance program. Certain workers who have secured employment in a new city can receive a relocation allowance of up to 90 percent of the “reasonable and necessary expenses” of moving, plus an additional lump-sum payment of up to $1,250. The unemployment-insurance system could create a similar program for the long-term unemployed, possibly financed by letting them take an advance on their UI benefits. In a new study, “Why Do Cities Matter? Local Growth and Aggregate Growth,” Chang-Tai Hsieh and Enrico Moretti finds that while New York, San Francisco, and San Jose were three of America’s most productive cities from 1964 through 2009, “growth in these three cities had limited benefits for the U.S. as a whole. The reason is that the main effect of the fast productivity growth in New York, San Francisco, and San Jose was an increase in local housing prices and local wages, not in employment.” From the study’s summary:
Worker fired for disabling GPS app that tracked her 24 hours a day - A Central California woman claims she was fired after uninstalling an app that her employer required her to run constantly on her company issued iPhone—an app that tracked her every move 24 hours a day, seven days a week. Plaintiff Myrna Arias, a former Bakersfield sales executive for money transfer service Intermex, claims in a state court lawsuit that her boss, John Stubits, fired her shortly after she uninstalled the job-management Xora app that she and her colleagues were required to use. According to her suit (PDF) in Kern County Superior Court:After researching the app and speaking with a trainer from Xora, Plaintiff and her co-workers asked whether Intermex would be monitoring their movements while off duty. Stubits admitted that employees would be monitored while off duty and bragged that he knew how fast she was driving at specific moments ever since she installed the app on her phone. Plaintiff expressed that she had no problem with the app's GPS function during work hours, but she objected to the monitoring of her location during non-work hours and complained to Stubits that this was an invasion of her privacy. She likened the app to a prisoner's ankle bracelet and informed Stubits that his actions were illegal. Stubits replied that she should tolerate the illegal intrusion…..
Why Your Wages Aren’t Going Up — Unemployment is down to 5.4%! Yay! That was the summary of last week’s unemployment report. Yet the two-track “recovery” — about to enter its seventh year — continues. Average hourly wages increased by only 0.1% in April and 2.2% for the past twelve months, which amounts to basically nothing when you take inflation into account. This is what the new normal looks like. Wages barely rise during periods of economic “expansion” (you know, the opposite of recession), then fall when unemployment spikes during a recession. In the long run, that means that average real earnings actually go down, and household income can only keep up if people work more hours. Yet the number of full-time jobs is lower today than it was before the financial crisis. John Komlos diagnosed the causes of wage stagnation two months ago in response to the March unemployment report and, unfortunately, not much has changed since then. In summary: “As long as there are still roughly 17 million workers underemployed, the nearly 300,000 jobs created last month are not going to make much of a dent in the immense amount of surplus labor available to corporations. … Plus, let us not forget that a lot of people left the labor market after the financial crisis began. The participation rate even among working-age adults (25–54 year olds) who did not take early retirement declined by 3.6 percent.”
If America really valued mothers, we wouldn’t treat them like this - Vox: The position requires skill in finance, medicine, and food preparation. It entails intense physical labor and a total collapse in your personal life. Oh, and it pays absolutely nothing. They called the job director of operations, but its real title, of course, is mom. Cardstore sent the video out into the world with the hashtag #WorldsToughestJob. But here's the thing about the world's toughest job: a lot of the people doing it also hold another job, or even a few other jobs. More than two-thirds of mothers hold jobs outside the home, and mothers are the primary earners in 40 percent of families. But in America, public policy makes balancing those jobs a lot harder than it has to be. America is, for instance, one of the only countries in the world that doesn't guarantee paid maternity leave. This map from UCLA's World Policy Analysis Center tells the tale well: our maternal leave policies make us look more like Papua New Guinea than, say, any country in Western Europe:
The Average Age Of A Minimum Wage Worker In America Is 36 - Did you know that 89 percent of all minimum wage workers in the United States are not teens? At this point, the average age of a minimum wage worker in this country is 36, and 56 percent of them are women. Millions upon millions of Americans are working as hard as they can (often that means two or three jobs), and yet despite all of their hard work they still find themselves mired in poverty. One of the big reasons for this is that we have created two classes of workers in the United States. “Full-time workers” are entitled to an array of benefits and protections by law that “part-time workers” do not get. And thanks to perverse incentives contained in Obamacare and other ridiculous laws, we have motivated employers to move as many workers from the “full-time” category to the “part-time” category as possible. It may be hard to believe, but right now only 44 percent of all U.S. adults are employed for 30 or more hours each week. But to get any kind of a job at all is a real challenge in many parts of the country today. As you read this article, there are more than 100 million working age Americans that are not employed in any capacity. And according to John Williams of shadowstats.com, if the federal government was actually using honest numbers the unemployment rate would be sitting at 23 percent. That is not an “employment recovery” – that is a national crisis.
Top CEOs Make 373 Times the Average U.S. Worker - The average U.S. worker has seen wages climb slowly over the past year. The average big-company chief executive has seen compensation jump far more substantially. CEOs at the nation’s largest publicly traded companies received 373 times the compensation of the average production and nonsupervisory worker last year, according to a new report Wednesday by the AFL-CIO. Figures compiled by the union federation show that the gap widened from a 331-to-1 ratio in 2013 as overall CEO compensation rose nearly 16% last year. The average worker’s wages rose just 2.4%. The average worker earned $36,134 in 2014, while the compensation for CEOs at S&P 500 companies averaged about $13.5 million, according to AFL-CIO calculations. The CEO-to-worker comparison, long produced by the union federation, has faced criticism from corporations that say it exaggerates CEO pay differences. The AFL-CIO’s measure of CEO pay includes stock options, equity awards and some perks for top executives in the S&P 500, while the measure for workers just includes pay, excluding pensions or employer contributions to 401(k) plans. AFL-CIO officials acknowledge some of the shortfalls, in part due to an absence of company-specific data showing what individual employers pay their employees. As a result, the report relies on Labor Department data on workers’ salaries. The figures cover cash wages, not stock options, equity awards, or even pensions or employer contributions to 401(k) plans – though the AFL-CIO says many average workers don’t get those benefits anyway. The union federation used the latest version of its report to press for higher pay for average workers and more transparency to the CEO-pay process. It wants companies to be required to disclose their CEO-to-median-employee pay ratios.
The Rules are What Matter for Inequality: Our New Report: I’m very excited to announce the release of “Rewriting the Rules of the American Economy” (pdf report), Roosevelt Institute’s new inequality agenda report by Joe Stiglitz. I’m thrilled to be one of the co-authors... As we argue, inequality is not inevitable: it is a choice that we’ve made with the rules that structure our economy. Over the past 35 years, the rules, or the regulatory, legal and institutional frameworks, that make up the economy and condition the market have changed. These rules are a major driver of the income distribution we see, including runaway top incomes and weak or precarious income growth for most others. Crucially, however, these changes in the rules have not made our economy better off than we would be otherwise; in many cases we are weaker for these changes. We also now know that “deregulation” is, in fact, “reregulation”—that is, a new set of rules for governing the economy that favor a specific set of actors, and that there's no way out of these difficult choices. But what were these changes? ... This report describes what has happened, going far deeper than this summary here. It also has a policy agenda focused on both taming the top and growing the rest of the economy. Some may emphasize some pieces more than others; but no matter what this argument about the rules is what is missing in the current debates over the economy. ...
Here’s the Secret Truth About Economic Inequality in America -- We all know that inequality has grown in America over the last several years. But the conventional wisdom among conservatives and even many liberals has always been that inequality was the price of growth–in order to get more of it, we needed to tolerate a bigger wealth gap. Today, Nobel laureate Joseph Stiglitz, the Columbia professor and former economic advisor to Bill Clinton, blew a hole in that truism with a new report for the Roosevelt Institute entitled “Rewriting the Rules,” which is basically a roadmap for what many progressives would like to see happen policy wise over the next four years. There are a number of provocative insights but the key takeaway–inequality isn’t inevitable, and it’s not just a social issue, but also an economic one, because it’s largely responsible for the fact that every economic “recovery” since the 1990s has been slower and longer than the one before. Inequality isn’t the trade-off for economic growth; rather, it’s both the cause and the symptom of slower growth. It’s a fascinating document, particularly when compared to the less radical Center for American Progress policy report on how to strengthen the middle class, authored by another former Clinton advisor, Larry Summers, which was widely considered to set out what may be Hillary Clinton’s economic policy agenda. While the two have some overlap, the Stiglitz report is bolder and more in-depth. It’s also a much more damning assessment of some of the policy changes made not only during the Bush years, but also during Bill Clinton’s tenure, in particular the continued deregulation of financial markets, changes in corporate pay structures, and tax shifts of the early 1990s. Stiglitz made the point that both Republican and Democratic administrations have been at fault in crafting not only policies that forward inequality, but also a narrative that tells us that we can’t do anything about it. “Inequality isn’t inevitable,” said Stiglitz. “It’s about the choices we make with the rules we create to structure our economy.”
Video: Stiglitz on Inequality, Wealth, and Growth: Why Capitalism is Failing
Fed says US wealth inequality hasn’t increased quite as much as you think - Some private equity tycoons may enjoy giving nine-figure sums to their colleges because they had a nice time at reunion the year before, but many of the ultra-rich don’t like flaunting their fortunes. That’s one of many reasons why it’s hard to measure the distribution of wealth. An innovative way around this problem is to take income tax data on rents, dividends, interest, and proprietors’ income, and then back out the implied asset values based on prevailing yields. When Emmanuel Saez and Gabriel Zucman did this for the US, they concluded that the share of wealth held by the top 0.1 per cent of Americans had increased by about 13 percentage points from its 1950-1980 average by 2013, with most of that increase due to the exceptional rise of the top 0.01 per cent: A new paper from economists at the Federal Reserve argues that this is an overestimate. According to them, the share of wealth held by the richest one-thousandth of the population increased by less than half as much. For the visual learners, this means they think the red line in the chart below is more accurate than the black line: Aside from its potential importance to the debate on inequality and the apparent rise of the ultra-rich, the Fed economists raise some interesting methodological questions. Recall that one of the more significant disagreements at this year’s meeting of the American Economics Association concerned the relative merits of asking people questions (survey data) versus watching what they actually do (administrative data), as Cardiff explained at the time. So it’s interesting that the Fed economists are arguing that survey data on the distribution of wealth — specifically, data from the Survey of Consumer Finances, which the Fed runs — are better than tax data.
Deep poverty undermines our economic potential --- Poverty has declined from around 26 percent in the 1960s to around 16 percent in 2012. But the range of change has been relatively flat since 2000, and a closer look at the numbers reveals a substantial and growing number of these households have incomes that are less than half the official poverty level. According to a recent report from the Brookings Institution, a Washington-based think tank, more than six percent of the U.S. population, including 7.1 million children, lived in deep poverty in 2011. Deep poverty is defined as having a cash income less than half of the federal poverty level (for example, the threshold in 2015 is an annual cash income of $12,125 for a married couple with two kids). In addition, over 1.5 million households in the U.S. lived in extreme poverty in 2011, defined as surviving on $2 or less in cash income per person per day. Both types of poverty have been growing recently, extreme poverty in particular. The Brooking report notes that while there is some disagreement in the literature, the 1996 welfare reforms are often cited by researchers as a primary cause. The work requirements in the measures along with time limits on benefits induced many households to begin working and they ended up better off. But many households were unable or unwilling, and when the cash assistance dried up these households "became reliant on a hodgepodge of government support, such as SNAP, housing subsidies, Medicaid/CHIP" that left them worse off overall. The report also asks who is in deep poverty:
- Over 10 percent of children younger than six live in families in deep poverty.
- 10 and 12 percent of black Americans and Hispanics, respectively, are in deep poverty as compared to only five percent of whites.
- Individuals and single-mother families are at greatest risk of falling into deep poverty.
Smart Social Programs - Jason Furman — DO government efforts to support low-income families work? Since the War on Poverty in the 1960s, skeptics have argued that even if these programs provide temporary relief, the only long-term impact is increased dependency — witness, they say, the persistent lack of mobility in places like inner-city Baltimore. But a growing body of research tells a very different story. Investments in education, income, housing, health care and nutrition for working families have substantial long-term benefits for children. Consider Moving to Opportunity, an experiment in the 1990s that gave families housing assistance, in some cases contingent on their moving to less poor neighborhoods. Initial evidence from the randomized trial was disappointing, finding little or no improvements in test scores for children or earnings for adults. A new paper by the Harvard economists Raj Chetty, Nathaniel Hendren and Lawrence F. Katz, however, followed the children for another decade. It found that traditional rental vouchers had increased their earnings as adults by 15 percent, and experimental vouchers, which required people to move to less poor neighborhoods, by 31 percent. The additional tax revenue from these higher earnings was enough to repay the program’s cost. This is only the latest in a number of recent studies that use big data to understand the longer-term effects of a range of government programs.
Food-Stamp Use Is Now the Lowest Since 2011 - The number of people receiving food stamps in the U.S. slipped to the lowest level in almost four years, a sign of an improving economy as well as more stringent qualification rules. According to new Agriculture Department data out this week, 45.68 million individuals in February participated in the food-stamp program, formally known as the Supplemental Nutrition Assistance Program. The department said it was the first time since August 2011 that the number of SNAP recipients stood below 46 million. The decline partly reflects improvement in the labor market. The number of food stamp participants soared during the Great Recession as many workers lost the job and continued to climb during the early years of recovery. The total SNAP users went from 26.3 million in fiscal year 2007 to 47.6 million in fiscal 2013. The number began to decline just after the unemployment rate slipped below 8% in early 2013. The jobless rate is now down to 5.4%, and the number of SNAP participants has fallen by almost 2 million since December 2012. More people working is not the only reason for the drop. Many states have tightened up their food-stamp requirements after those qualifications were loosened during the recession. According to a late-2014 study by the Pew Charitable Trusts, at least 17 states planned to reinstate work requirements that raised the bar for childless adults aged 18 to 50 years to receive food stamps. Who receives food stamps has been part of the debate over raising the minimum wage. A study by economists at the University of California at Berkeley, found that from 2009 to 2011, 36% of families receiving food stamps had at least one family member who worked 10 hours or more per week. The study found that employees in low-wage occupations, many earning the minimum wage, were the most likely workers to receive public assistance of some kind.
Less Support for the Death Penalty - I have written on elements of the death penalty previously Execution could be cheaper if we were to subvert the rights of prisoners during trial and on appeal to state and federal courts. A 2003 legislative audit in Kansas revealed total costs for the death penalty at 70% more than non-death sentence cases with a median cost of $1.26 million as opposed to $.74 million. Since 1995 when the death sentence was reinstated in NY, the cost for each of 5 people condemned, not executed yet, was ~$23 million per person for a total of $165 million. The Comptroller for the state of Tennessee audit revealed that death sentences cases increased costs by 48%. These are costs associated with the trial up till and including sentencing and not taking into account appeals. “New Jersey taxpayers over the last 23 years have paid more than a quarter billion dollars on a capital punishment system that has executed no one.” 197 capital cases, 60 convictions, 50 overturned, and no executions carried out since 1983. Average cost = ~$25 million/conviction. And if they are innocent? From 1973 through 2003, 125 prisoners have been released from death row due to wrongful convictions. In 2003 alone, 10 prisoners were released. In 2000, Illinois Governor Ryan commuted the sentences for 167 inmates on death roll to natural life in prison. His reasoning was he could not be sure of whether the convictions were legitimate after releasing the 13th inmate from death roll due to wrongful conviction. 13 of 180 or ~7% error rate in Illinois. ~3800 inmates were on death row in 2000 and up till that point, 125 were released and exonerated for a percentage of ~3.2%. While not exact (it is probably higher), the 3.2% stands in defiance of Louisiana State Prosecutor Marquis and Supreme Court Justice Scalia’s claim of less than 1% being innocent and sentenced to death.” A recent PEW study is showing a change in the attitudes of people towards execution. While the study still shows the majority of the population believes in executing prisoners convicted of murder, the people in favor of it are at the one of the lowest levels in 40 years. 56% of the populations are in favor of the death penalty and 38% oppose the death penalty.
MAP: Which States Relied the Most on Federal Aid in 2013? - Though taxes are the most common and recognizable source of state government revenues, it's important to remember that they're not the only source. In fact, state governments received 30.0 percent of their total general revenues from transfers from the federal government in the 2013 fiscal year. That number varies pretty widely for specific states, however. For example, Mississippi obtained 42.9 percent of its total state general revenues from the federal government (the largest share in the country). Also on the high end are Louisiana (41.9 percent), Tennessee (39.5 percent), South Dakota (39.0 percent), and Missouri (38.2 percent). On the other end of the spectrum are those states who received a much smaller share of general revenues from the federal government. The lowest federal share occured in North Dakota at 19.0 percent, followed by Hawaii (21.5 percent), Alaska (22.4 percent), Virginia (22.9 percent), and Connecticut (23.4 percent). For all fifty states, see the map below. Note that this measure of general revenue includes tax collections but excludes utility revenue, liquor store revenue, and insurance trust revenue.
Why subsidize data centers? --- A number of authors (Good Jobs First, David Cay Johnston, me, and me, among others) have pointed out that data centers (aka server farms) in the United States create very few jobs, yet receive state and local government subsidies that routinely exceed $1 million per job. I’m sure you already know that numbers like those make me ill: the typical automobile assembly plant will receive $150,000 or so per job, and require all sorts of component facilities to feed it — though, sadly, economic development officials often given incentives to the supplier plants as well. So why $1 million or more per job? Data centers pay reasonably well, and the biggest are connected to famous tech names like Apple, Google, and Facebook, but it seems to me that it’s hard to get around the facts that there just aren’t that many jobs, and they don’t require an army of supplier facilities bringing indirect jobs. But surely the competition for jobs is so steep that governments have no choice but to subsidize them? Actually, no. Aside from the fact that $1 million per job probably gives away more than the value of the investment to the government, my investigations have turned up multiple examples of companies building data centers without incentives. One I’ve mentioned here before: American Express in 2010 built a $400 million data center in Greensboro, North Carolina, without any incentives at all. The leading explanation has been that Amex had already decided it was going to close a 1900-job call center in Greensboro (announced in 2011), a move it knew would trigger clawbacks of any incentives on the 50-150 job data center — so it didn’t bother seeking subsidies. Did I mention that North Carolina has cheap electricity? More recently, I have found four Google data centers that opened or expanded without incentives in the last few years. New and expanded facilities in the Netherlands, Ireland, Finland, and Belgium all take advantage of cooler temperatures to reduce their electricity use.
Almost Half Of US States Are Officially Broke -- Last month, we documented the case of Louisiana State University, the large, well-known public institution whose 2014 enrollment totaled nearly 31,000 students. LSU, it turns out, is facing funding cuts of as much as 82% which, if realized, would likely force the school into financial exigency, the college equivalent of bankruptcy. The reason for the cuts: the sharp decline in oil prices and fiscal mismanagement have conspired to blow a $1.6 billion hole in the state’s budget. The real problem however is that large budget shortfalls aren’t confined to Louisiana. In fact, a new study from AP shows that big gaps are becoming more the rule than the exception across the US. Via AP: An Associated Press analysis of statehouse finances around the country shows that at least 22 states project shortfalls for the coming fiscal year. The deficits recall recession-era anxiety about plunging tax revenue and deep cuts to education, social services and other government-funded programs. The sheer number of states facing budget gaps prompted Standard & Poor's Ratings Service to call the trend a sort of "early warning." "After all, if a state is grappling with a budget deficit now, with the economic expansion approaching its sixth anniversary, what will be its condition when the next slowdown strikes?"
Moody's cuts Chicago's credit rating to junk - -- Moody's Investors Service said Tuesday it has downgraded its credit rating on the City of Chicago to Ba1 from Baa2, a move that brands the city's debt "speculative." The move impacts $8.1 billion of Chicago's outstanding general obligation debt, $542 million of outstanding sales tax revenue debt and $268 million of motor fuel tax revenue debt. Moody's said the lower credit rating reflects Chicago's "highly elevated unfunded pension liabilities", adding "we believe that the city's options for curbing growth in its own unfunded pension liabilities have narrowed considerably." Highlighting pressure on Chicago's budget, Moody's cited a 179% jump in contributions the city is obligated to make next year to its police and fire pension funds.
Chicago Faces $2.2 Billion Bank Payout After Rating Cut to Junk - Chicago may have to pay banks as much as $2.2 billion after Moody’s Investors Service dropped its credit rating to junk, deepening the fiscal crisis in the third-largest U.S. city. The company’s decision Tuesday to cut Chicago’s $8.1 billion of general obligations two ranks to Ba1, one step below investment grade, allows banks to demand that the city repay debt early and exposes it to fees to end swaps contracts, Moody’s said in a statement. JPMorgan Chase & Co., Barclays Plc and Wells Fargo & Co. are among the city’s bankers. The downgrade adds to the financial pressure on Chicago, which was already the lowest-rated of any big U.S. city except Detroit. It follows an Illinois Supreme Court ruling last week that safeguards retirement benefits, casting doubt on Chicago’s ability to curb its $20 billion pension-fund shortfall.
Moody's Cuts Chicago Bond Rating to Junk; City Faces $2.2 Billion in Various Termination Fees; Irresponsible to Tell the Truth -- The shockingly bad fiscal health of Chicago just got a lot worse. Not only were Chicago Teachers "Insulted by a 7% Pay Cut Offer", the Illinois Supreme Court ruled Illinois' 2013 pension reform is unconstitutional. As a result of the Supreme Court ruling, Illinois' already horrendously underfunded pension plans are even more underfunded. In a decision today, citing pension analysis, Chicago Rating Cut to Junk by Moody’s. Chicago had its credit rating cut to junk by Moody’s Investors Service after the Illinois Supreme Court’s rejection of a state pension-overhaul plan reduced the city’s options for fixing its own underfunded system. The two-level downgrade to Ba1 affects $8.1 billion of general obligations, which were already the lowest-rated among the 90 biggest U.S. cities, excluding Detroit. The outlook is still negative. Moody’s has dropped the city seven levels since July 2013. The reduction to the highest level of junk “incorporates expected growth in the city’s highly elevated unfunded pension liabilities,” Moody’s said Tuesday. After the May 8 court ruling, “we believe that the city’s options for curbing growth in its own unfunded pension liabilities have narrowed considerably.” The deterioration in the credit standing of the third-most-populous U.S. city underscores how pension promises are squeezing the finances of states and localities nationwide. Moody’s downgrade compounds Chicago’s fiscal struggles: its counterparties can immediately demand as much as $2.2 billion in accelerated principal, accrued interest and termination fees, New York-based Moody’s said in the report.
Chicago "Junking" Triggers $2.2 Billion Payment, Deepening Financial Crisis -- In early March, we discussed the rather deplorable state of Illinois’ public pension plans which, we noted, are underfunded by some 60%. On a statewide basis, making up the deficit would cost around $22,000 per household, which gives you an idea of the cost to taxpayers of the grossly underfunded pension liabilities. A month later, we pointed out the fact that spreads between Chicago’s muni bonds and USTs had blown out to the tune of 60bps as mayor Rahm Emanuel's re-election became more assured. The situation worsened materially last Friday when the Illinois Supreme Court struck down a pension reform law that aimed at closing the state’s $105 billion hole. Via The Chicago Tribune:The Illinois Supreme Court on Friday unanimously ruled unconstitutional a landmark state pension law that aimed to scale back government worker benefits to erase a massive $105 billion retirement system debt, sending lawmakers and the new governor back to the negotiating table to try to solve the pressing financial issue. That ruling, it turns out, would be the death knell for Chicago’s credit rating, at least as far as Moody’s is concerned. Citing “expected growth in the city’s highly elevated unfunded pension liabilities,” the rating agency cut the city to junk at Ba1. This is bad news for Chicago for a number of reasons, not the least of which is the fact that Emanuel was looking to refi nearly a billion dollars in floating rate debt into fixed rate notes and borrow another $200 million to pay off the related swaps — clearly this will now be far more difficult. The ratings agency’s actions also given creditors accelerated payment rights, meaning the city could be on the hook for some $2.2 billion in principal and interest on its outstanding liabilities.
Standard & Poor's Gives Chicago's Credit Rating Another Hit - Chicago's credit rating took another hit with the decision by Standard & Poor's to lower the rating of the city's general obligation bonds two notches to A- from A+, still investment grade. Standard & Poor's action Thursday follows a decision earlier this week by Moody's Investor's Service to lower Chicago's credit worthiness to junk status. The lower credit ratings increases the cost of the city's borrowing. Standard & Poor's cited Moody's action in its decision. The rating agency said Chicago Mayor Rahm Emanuel's plans to convert debt with fluctuating interest rates to fixed-rate bonds to help stabilize city finances could be jeopardized by Moody's action. Like Moody's, Standard & Poor's referred to last week's Illinois Supreme Court decision overturning a state pension overhaul. Emanuel has called Moody's downgrade "irresponsible."
Who Is Coming to America? Increasingly, Chinese Students and Indian 20-Somethings -- China and India are sending more immigrants to the U.S. than Mexico, following more than a decade of decreasing immigration from Latin America, according to the latest numbers from the Census Bureau. So, who exactly is coming? It’s hard to say, but a good guess is that Chinese college students and 20-something Indian workers are playing a big role. Recent U.S. immigrants from China were more likely to be college-aged in 2011 to 2013 than in 2005 to 2007, according to a Census study presented this month at the Population Association of America’s annual demography conference. The study uses data from the American Community Survey, which asks respondents if they are foreign-born and lived abroad a year ago. Between these two time periods, 2005-07 and 2011-13, the age groups that saw the largest percentage point increases were 15 to 19 years old and 20 to 24 years old, for both men and women, Census said. These ages are roughly around the time people go to college—though, of course, plenty of young Chinese immigrants may not be going to college but may instead be in low-wage jobs or something else. This makes sense. U.S. universities are enrolling record numbers of foreign students, including many affluent Chinese. The number of foreign students in the U.S.—most in college-degree programs—is up nearly 50% from 2010 and 85% from 2005. Students from China account for around 30% of foreign students. India is a different case. The Census study suggests the “age structure” of inflows of immigrants from India looks roughly the same in the two time periods. In both cases, the flows are concentrated in the 20 to 34 age group, especially people ages 25 to 29, for both men and women. These are potentially young workers starting and building their careers, or postgraduates getting more education—as opposed to older people or college students or teenagers.
Would graduating more college students reduce wage inequality? - In their influential 2010 book, The Race between Education and Technology, Harvard University economists Claudia Goldin and Lawrence Katz offer an explanation for the United States’ decades-long rise in wage inequality. In their view, the main reason that inequality has increased so much is because the supply of educated workers has not kept pace with an ever-growing demand–especially for workers with a college degree. The short supply of college-educated workers has driven up their price relative to the rest of the workforce, accounting for most of growing gap between workers at the top and the bottom of the earnings ladder. The research implies that the most direct and effective way to reduce the wage gap is to expand the share of the workforce with a college degree. Goldin and Katz’s diagnosis and prescription represent the predominance of rising wage inequality within academic and Washington policy circles. But, this spring, first in public remarks and later in an interview with the Washington Post, Harvard economist Lawrence Summers declared that focusing on education and training as a way to reduce inequality is “whistling past the graveyard” and “fundamentally an evasion.” Their more formal analysis concluded “Increasing educational attainment will not significantly change overall earnings inequality” but would “reduce inequality in the bottom half of the earnings distribution, largely by pulling up the earnings of those near the 25th percentile.” We argue that Hershbein, Kearney, and Summers get it right when they conclude that even a large jump in college attainment would have little impact on overall earnings inequality. But we also believe that they are overly optimistic in their assertion that increasing college attainment will reduce inequality at the bottom.
Nice Ivy League Degree. Now if You Want a Job, Go to Code School -- In a Boston basement that houses a new kind of vocational training school, Katy Feng says she’s working harder than she ever did at Dartmouth College. The 22-year-old graduated last year with a bachelor’s degree in psychology and studio art that cost more than a quarter-million dollars. She sent out dozens of résumés looking for a full-time job in graphic design but wound up working a contract gig for a Boston clothing store. “I thought, they’ll see Dartmouth, and they’ll hire me,” Feng says. “That’s not really how it works, I found.” She figures programming is the best way to get the job she wants. Hence the basement, where she’s paying $11,500 for a three-month crash course in coding. Feng is among thousands of students, about 70 percent of whom already have college degrees, flocking to coding boot camps. Hers is run by a company called General Assembly that promises to transform “thinkers into creators,” not to mention holders of well-paying jobs. It’s an especially attractive pitch for humanities and social sciences majors who didn’t learn the skills they need to compete for the plentiful jobs in the technology industry. Four years ago, General Assembly was among the first of these training schools; now there are more than 80. About 6,000 students graduated from a coding boot camp in 2014, triple the previous year, says Course Report, a website that lets students rate the various courses. The schools took in a combined $59 million in revenue, or about $9,833 per student, estimates Course Report co-founder Liz Eggleston.
The Class of 2015 Might Have a Little Better Luck Finding a Good Job - NY Fed - With the college graduation season well under way, a new crop of freshly minted graduates is entering the job market and many bright young minds are hoping to land a good first job. It’s no wonder if they are approaching the job hunt with some trepidation. For a number of years now, recent college graduates have been struggling to find good jobs. However, the labor market for college graduates is improving. After declining for nearly two years, openings for jobs requiring a college degree have picked up since last summer. Not only has this increase in the demand for educated workers continued to push down the unemployment rate for recent graduates, but it has also finally started to help reduce underemployment, though the underemployment rate remains high. While successfully navigating the job market will likely remain a challenge, it appears that finding a good job has become just a little bit easier for the class of 2015. To measure the demand for college graduates, we use the Help Wanted OnLine (HWOL) database of online job postings from the Conference Board. We classify postings into one of two categories based on the occupation code associated with each job opening: College jobs are those that typically require at least a bachelor’s degree, and non-college jobs are those that don’t (for more detail on the methodology used for this classification, see our article, “Are Recent College Graduates Finding Good Jobs?”). The trend in job postings for both types of jobs is shown in the chart below.
Corinthian Colleges’ Lean Business Model Leaves Little for Creditors - Corinthian Colleges, the for-profit education company familiar to corporate law professors for its appearance in textbooks about securities regulation, now has a chance to appear in bankruptcy and restructuring texts as well. Corinthian filed for Chapter 11 bankruptcy protection in Delaware on Monday, along with two dozen affiliates. Its petition lists more than $100 million in debt owed to its secured lenders and at least $100 million more in unsecured debt. Its liabilities include $1.25 million in “trade debt” owed to Barclays Capital, most likely connected to Barclays’s attempts to sell the company, and hundreds of thousands of dollars owed to a host of law firms, which have handled an onslaught of litigation. Corinthian also owes an “unknown” amount to the Department of Education. It listed assets of $19.2 million. Corinthian, based in Santa Ana, Calif., has been operating since July under a board-appointed chief restructuring officer, William J. Nolan, an employee of a large consulting firm. It has also been overseen by a monitor appointed by the Education Department, Patrick Fitzgerald, a former prosecutor who is now a partner at a leading law firm. It has been a long slide for Corinthian, once a Wall Street darling. But federal and state regulators accused it of falsified placement rates, deceptive marketing and predatory recruiting, particularly of low-income students. The last of its campuses closed in late April. The main question for creditors is whether there is anything for them to recover.This includes various student groups, which have proclaimed their intent to continue to sue Corinthian and hold it responsible for what they describe as a systematic pattern of misleading students to borrow money to attend.
College Grads are Drowning in Student Loan Debt - This month, as 1.8 million newly-minted bachelor’s degrees are handed out, most graduates will be coming off the stage with much more than a fancy piece of paper. Seventy percent will take an average of $27,000 in student loan debt with them as they try to build their careers after college.This debt carries major consequences. One recent graduate, Annie Johnson, who is $70,000 in debt told us this: My student loan bills are nearly $900 a month. I see a quality-of-life difference between myself and my friends who do not have student loan debt. Saving is really hard when living expenses are added to my student loan payments. I know this is already setting me back in terms of retirement savings. My future options are limited since, in order to advance my career, I have to go back to school. But to go back to school, I would have to add to my debt. This recent graduate is not alone. Almost 40 million people have student loan debt, which is the only category of household debt that continued to rise during the recession, and fifteen percent of borrowers default within the first three years. The 90-day delinquency rate on student loan debt is 11 percent. This is higher than the delinquency rate for residential real estate loans (3 percent) and the credit card delinquency rate (7 percent). Since 2004, overall student loan debt increased by 325 percent, while all other categories of non-housing debt decreased by 5 percent. Over that time, the number of borrowers owing between $50,000 and $75,000 has doubled, and the number of borrowers owing more than $200,000 has tripled.
Discharge Private Student Loans, But Federal Loans Have Safety Net - Unsecured debts are presumptively dischargeable in bankruptcy. Student loan debt, however, is different from other types of unsecured debt in one critical way: Most of it is owed to the federal government. The government’s position as creditor counsels against allowing the ready dischargeability of federal student loans both because it creates problems of distributional fairness and because it means there are alternative formal channels available for managing loan repayment. By the same token, however, there is no basis for special treatment for private student loans, which should be freely dischargeable, as they were prior to 2005. Allowing the ready discharge of federal student loans creates distributional problems because federal student loan pricing is not risk-based; it is one-size-fits-all pricing. If existing federal student loans were to become dischargeable in bankruptcy, the costs would be borne by either future borrowers or taxpayers. Neither outcome would be desirable. It’s unfair to ask future borrowers to subsidize the earlier borrowers. Changing student loan dischargeability creates a serious intergenerational equity problem. If federal student loans were dischargeable only prospectively, this intergenerational equity problem wouldn’t exist, but the motivating policy concern is existing debt. Likewise, taxpayers shouldn’t be asked to subsidize the costs of discharged student loan debt except in cases of true hardship caused by factors beyond the debtor’s control. The bankruptcy discharge functions as a form of mandatory social insurance. Mandating such social insurance makes sense for risks consumers cannot avoid, such as illness, accidents and business cycle fluctuations. Thus, to the extent that a consumer cannot repay his or her student loan debt because of incapacity or the like, due to factors beyond the consumer’s control, discharge makes sense. But taxpayers shouldn’t be asked to fund mandatory insurance against poor educational and career decisions.
Bankruptcy and Student Loan Debt - My thoughts on whether the Bankruptcy Code should be amended to allow easier discharge of student loan debt are upon The Examiners at the Wall St. Journal. Short of it is yes for private student loans, no for public student loans. I'm sure to catch hell for this from some of the more aggressive student loan forgiveness advocates, given that most of the market is public student loans, but there are other restructuring and foregiveness options available for public loans and serious fairness problems with allowing discharge of existing student loans. New borrowers shouldn't have to subsidize older ones' dischargeability, and taxpayers shouldn't be picking up the tab for social insurance to the extent that bad educational/career choices are within individuals' control.
Young Americans have yet another debt burden -- Along with everyone else in America, you owe $15,052 to cover the total unfunded pension liabilities of state governments. Both red and blue states face towering unfunded promises because the defined-benefit pension system allows politicians from all parties to grant something for nothing — and to defer the inevitable bill. Tennessee is in the best financial shape, with $6,531 per person in liabilities. It is followed by Wisconsin, at $6,720; and Indiana, at $7,304. Alaska is in the worst shape, with $40,639 a person. In the continental United States, the state in the worst shape is Illinois, at $25,740; followed by Ohio, at $25,028; and Connecticut, at $24,080. States are in this situation because during economic booms they deliver more generous pensions to their employees, but during economic downturns, these increases are rarely pared back. This means that states make promises to public-sector unions that they usually cannot afford. Absent major concessions, these pensions will have to be paid over time to the 19 million men and women who work for a state, county, municipal or school-district government. If pension-fund income is insufficient to cover those obligations, as is expected, those who will be on the hook to pay will be today’s young Americans, who have college loans, high unemployment rates and lower incomes than the public-sector workers. As they progress in the workforce, they will be responsible for the debts.
Pubic Opinion of the PPACA: A recent Kaiser Poll shows favorable results for the PPACA the first time since 2012. 43% have a favorable view of the PPACA and 42% have an unfavorable view of it. While the report shows a favorable view, it is within the margin of error (+ or – 3%) and not statistically significant Click on the graph[s] for a larger version). Even though the Public’s View is split and slightly favoring the PPACA, the percentage of people who wish Congress to finish implementation or expand the PPACA is 46% as opposed to those wishing to repeal or scale it back at 41%. This opinion has remained consistent for six months of the Kaiser survey. In how the PPACA is viewed plays mostly along partisan political lines with Democrats favoring it and Republicans opposing it. In total, it is an equal split favoring and opposing it. Does the PPACA hurt, help, or have a direct impact upon you. Again, this plays along the partisan political beliefs of the people with Democrats claiming it helped as opposed to the Republicans claiming it hurt. In all three cases and taking into consideration the politics of the people, the majority claimed the PPACA had “No Direct Impact” upon them.
Court case shows how health insurers rip off you and your employer - If you think you’re paying too much for employer-sponsored health coverage, you might want to forward this to the HR department. It’s possible, maybe even likely, that your health insurer has been ripping off both you and your employer—to the tune of several million dollars every year—for decades. Many Americans, according to various polls, blame Obamacare for every hike in premiums despite the fact that the rate of increase for most folks was actually greater before 2010, the year the law went into effect. Health insurers are delighted that many folks blame Obamacare for rate increases because it deflects attention away from them and, according to documents made public in a recent lawsuit against a big Blue Cross plan, the questionable activities they’ve been engaging in for years to boost profits. It turns out that one of the reasons workers have been paying more for their coverage is allegedly a common practice among insurers: charging their employer customers unlawful hidden fees. The fees came to light when Hi-Lex Controls, an automotive technology company, took Blue Cross Blue Shield of Michigan (BCBSM) to court in 2013 after becoming suspicious that the company had been systematically cheating it over 19 years. After reviewing evidence in the case, a judge ordered that BCBSM stop charging the hidden fees and pay Hi-Lex $6.1 million.
Overkill: An avalanche of unnecessary medical care is harming patients physically and financially. What can we do about it? - The researchers called it “low-value care.” But, really, it was no-value care. They studied how often people received one of twenty-six tests or treatments that scientific and professional organizations have consistently determined to have no benefit or to be outright harmful. Their list included doing an EEG for an uncomplicated headache (EEGs are for diagnosing seizure disorders, not headaches), or doing a CT or MRI scan for low-back pain in patients without any signs of a neurological problem (studies consistently show that scanning such patients adds nothing except cost), or putting a coronary-artery stent in patients with stable cardiac disease (the likelihood of a heart attack or death after five years is unaffected by the stent). In just a single year, the researchers reported, twenty-five to forty-two per cent of Medicare patients received at least one of the twenty-six useless tests and treatments. Could pointless medical care really be that widespread? Six years ago, I wrote an article for this magazine, titled “The Cost Conundrum,” which explored the problem of unnecessary care in McAllen, Texas, a community with some of the highest per-capita costs for Medicare in the nation. But was McAllen an anomaly or did it represent an emerging norm? The report found that higher prices, administrative expenses, and fraud accounted for almost half of this waste. Bigger than any of those, however, was the amount spent on unnecessary health-care services. Now a far more detailed study confirmed that such waste was pervasive.
California Supreme Court Shows How Pharma ‘Pay For Delay’ Can Violate Antitrust Laws -- For many years now, we've been talking about the problematic practice of "pay for delay" in the pharma industry. This involved patent holders paying generic pharmaceutical makers some amount of money to not enter the market in order to keep their own monopoly even longer. There's a complex process behind all of this, which often involves the larger pharmaceutical company first suing a generic maker, and then "settling" by agreeing to pay a sum of money to the generic maker. But, part of the "settlement" is that the generic drugmaker stays out of the market for longer than they otherwise would have needed to do so. Either way, there have been a number of anti-trust lawsuits filed over these practices and finally, in 2013, in a case against Actavis, the Supreme Court ruled that these kinds of deals may violate antitrust laws, and the FTC had every right to use antitrust law against drugmakers. Late last year, the FTC finally put those powers to use (meanwhile, over in Europe, regulators have been going after the same practice). And yet, even with the Supreme Court weighing in, all is not yet settled. Here in California, there was a separate case, revolving around pharma giant Bayer and the making of its super popular drug Cipro. There were a few different issues raised in this case, focusing mainly on whether California's state antitrust law could also be used against these deals (rather than just federal antitrust law) and also what "test" had to be used to determine if these deals violated the law (and, as part of that, whether you could presume that any such pay for delay deal must violate antitrust law).
The Projected Improvement in Life Expectancy -- Here is something different, but it is important when looking at demographics ... The following data is from the CDC United States Life Tables, 2010. The most frequently used life table statistic is life expectancy (ex), which is the average number of years of life remaining for persons who have attained a given age (x). ... Life expectancy at birth (e0) for 2010 for the total population was 78.7 years. ... Another way of assessing the longevity of the period life table cohort is by determining the proportion that survives to specified ages. ... To illustrate, 57,188 persons out of the original 2010 hypothetical life table cohort of 100,000 (or 57.2 %) were alive at exact age 80. Instead of look at life expectancy, here is a graph of survivors out of 100,000 born alive, by age for three groups: those born in 1900-1902, born in 1949-1951 (baby boomers), and born in 2010.There was a dramatic change between those born in 1900 (blue) and those born mid-century (orange). The risk of infant and early childhood deaths dropped sharply, and the risk of death in the prime working years also declined significantly. The CDC is projecting further improvement for childhood and prime working age for those born in 2010, but they are also projecting that people will live longer. The second graph uses the same data but looks at the number of people who die before a certain age, but after the previous age. As an example, for those born in 1900 (blue), 12,448 of the 100,000 born alive died before age 1, and another 5,748 died between age 1 and age 5. That is 18.2% of those born in 1900 died before age 5. Now the CDC is projection the peak age for deaths - for those born in 2010 - will increase to 86 to 90!
Why Do We Give Medical Treatment That Increases Patients' Chances of Dying? -- We know that in many people, high blood pressure is bad. We therefore try and do things to lower it. But then we go ahead and decide that if lowering blood pressure in some people is good, it must be good for everyone. In frail, elderly people, however, there's no evidence for this—and there may be evidence that lowering blood pressure is a bad idea. This was a longitudinal study of elderly people living in nursing homes, meaning that the authors recruited people there and then followed them for about two years. They were interested in seeing how different aspects of care were related to the subjects' chance of dying. Almost 80 percent of them were being treated for high blood pressure (in spite of the above). A previous analysis of this study had shown that blood pressure was inversely related to all-cause mortality "even after adjusting for several confounders, such as age, sex, history of previous cardiovascular (CV) disease, Charlson Comorbidity Index score, cognitive function (Mini-Mental State Examination), and autonomy status (activities of daily living)." This study went further, to look at whether being on lots of drugs for high blood pressure was bad—even after controlling for the blood pressure relationship.Patients in this study were on an average of seven drugs and were on at least two drugs for high blood pressure. What the study found, to no one's real surprise, is that the people on two or more blood pressure medications who had a systolic blood pressure of less than 130 mm Hg had a significantly higher all-cause mortality. This held true even after additionally adjusting for propensity score–matched subsets, other cardiovascular issues, and the exclusion of patients without a history of hypertension who were receiving BP-lowering agents. We know that there’s evidence that keeping blood pressure lower in this population might be bad. Yet, many of these patients were not only being treated for "high" blood pressure—many were on multiple medications for it. Those on more medications (i.e. more treatment) were more likely to die.
No One's Talking About What The Pacific Trade Deal Means For Diets -- If you think trade deals are just about business, think again. They can also have a sweeping effect on how people eat. Take all those avocados, watermelon and cervezas from Mexico we now consume, and the meat and feed corn for livestock we send there in exchange.The Obama administration hasn't shared much detail about the provisions in its controversial Trans-Pacific Partnership, the free trade deal between the U.S. and 11 countries currently being negotiated. But if it's anything like prior free trade agreements, two things are likely, trade experts say.First, it will have a potentially troubling effect on food and diet in member countries. Second, no one will talk about these dimensions of the deal before it's inked. "Trade agreements don't deal at all with diet and health," Eric Holt-Gimenez, executive director of Food First, a national food and development nonprofit, tells The Salt. "What's a concern is opening up markets. They're not expanding businesses to improve diets, they're doing that to meet the bottom line." One example of a trade deal that should have addressed nutrition and health, according to Holt-Gimenez: The North American Free Trade Agreement boosted American consumption of Mexican produce, but also paved the way for Walmart and American food manufacturers to export and sell a lot more less-healthful, processed food in Mexico. Yet "no-one even bothered to ... develop legislation that would address the impoverishment of the Mexican diet as a result of eating all of the processed foods sold out of Walmart," says Holt-Gimenez. U.S. officials say they have no plans to explore the health impacts of the TPP. "We do not see conclusive evidence that trade agreements themselves have a major impact on diet and health one way or the other," Cullen Schwarz, press secretary for the U.S. Department of Agriculture, writes in an email. For that reason, he says, it has not been part of the discussion.
Smokeless China -- In a few weeks, Beijing will implement a city-wide ban on smoking in all indoor public spaces, such as restaurants and offices, as well as on tobacco advertising outdoors, on public transportation, and in most forms of media. If the initiative, agreed late last year by the municipal people’s congress, is successful, China may impose a similar ban nationwide. A significant decline in smoking would undoubtedly bring enormous public-health benefits to China. But is it feasible? With an estimated 300 million smokers, China represents one-third of the world’s total and accounts for an average of roughly 2,700 tobacco-related deaths per day. The costs of treating smoking-related diseases, not to mention the associated productivity losses, are considerable. But China has so far struggled to reduce smoking or enforce bans effectively. Indeed, despite ratifying the World Health Organization’s Framework Convention to Tobacco Control in 2005, China failed to fulfill its commitment to ban indoor smoking by 2011. Moreover, tobacco output increased 32%. Bans have since been implemented in 14 Chinese cities, including Shanghai, Hangzhou, and Guangzhou. But they have done little to reduce smoking, owing not only to weak enforcement, but also to the prevailing view, held by 75% of Chinese adults, that smoking does not cause serious harm. (Only about 16% of Chinese smokers report an intention to quit.) Against this background, the Beijing municipal authorities’ plan to fine smokers up to CN¥200 ($32) for lighting up in public places appears unpromising at best.
Genome-wide DNA study shows lasting impact of malnutrition in early pregnancy -- Researchers at Columbia University's Mailman School of Public Health and Leiden University in the Netherlands found that children whose mothers were malnourished at famine levels during the first 10 weeks of pregnancy had changes in DNA methylation known to suppress genes involved in growth, development, and metabolism documented at age 59. This is the first study to look at prenatal nutrition and genome-wide DNA patterns in adults exposed to severe under-nutrition at different periods of gestation. Findings are published in the International Journal of Epidemiology. The study evaluated how famine exposure -- defined as 900 calories daily or less -- during the Dutch Hunger Winter of 1944-1945 affected genome-wide DNA methylation levels. The researchers also studied the impact of short-term exposure, pre-conception and post-conception. The findings show associations between famine exposure during weeks 1-10 of gestation and DNA changes, but not later in pregnancy. DNA methylation changes were also seen among individuals conceived at the height of the famine between March and May 1945 who were not exposed to all 10 weeks of early gestation. "The first ten weeks of gestation is a uniquely sensitive period when the blood methylome -- or whole-genome DNA methylation -- is especially sensitive to the prenatal environment," said L.H. Lumey, MD, PhD, associate professor of Epidemiology at the Mailman School of Public Health, and last author. "This is the period when a woman may not even be aware that she is pregnant."
Liberia Is Declared Free of Ebola, but Officials Sound Note of Caution - NYTimes.com: The World Health Organization declared Liberia free of Ebola on Saturday, making it the first of the three hardest-hit West African countries to bring a formal end to the epidemic.“The outbreak of Ebola virus disease in Liberia is over,” the W.H.O. said in a statement read by Dr. Alex Gasasira, the group’s representative to Liberia, in a packed conference room at the emergency command center in Monrovia, the capital.Just before Dr. Gasasira’s statement, Luke Bawo, an epidemiologist, showed a map depicting all of Liberia in green with the number 42 superimposed on it. This represented that two maximum incubation periods of the virus, a total of 42 days, had passed since the safe burial of the last person confirmed to have had Ebola in the country, fulfilling the official criteria for concluding that human-to-human transmission of the virus has ended.The W.H.O. says there were more than 3,000 confirmed Ebola cases in Liberia, and 7,400 suspected or probable cases, with more than 4,700 deaths estimated to have occurred since the outbreak was declared there in March 2014. Among the dead were 189 health care workers. Tolbert Nyenswah, a senior Liberian health official who leads the country’s Ebola response efforts, said in an interview that the end of the epidemic was “a victory for Liberia and Liberians.” “The only caution,” he said, is that “we are very much concerned about Guinea and Sierra Leone.”
Dengue cases soar in Brazil, as death toll climbs – City of Piracicaba releases transgenic mosquitos – Cases of dengue have soared in Brazil where the disease has caused 229 fatalities this year, the health ministry has said, as authorities try to combat its spread using transgenic mosquitos. The health ministry said it had logged 745,900 cases nationwide in the first 15 weeks of the year — an annual increase of 234 per cent. That equates to 367.8 people infected per 100,000 residents, which falls into the category of an epidemic under parameters used by the World Health Organization. The number of dengue deaths has climbed 44 per cent from the same period last year, and most of the diagnosed cases have occurred in business hub São Paulo. In all, São Paulo has seen 169 fatalities and 401,564 cases this year — a high since records began in 1990. Cases of the mosquito-borne infectious tropical disease increased in the wake of a serious drought last year, the worst in living memory. Severe water shortages led residents to store what they could in open receptacles, which facilitated the spread of dengue. Last Thursday the city of Piracicaba, located 160km (100 miles) west of São Paulo, released its first batch of 100,000 transgenic male mosquitos in reaction to the growing crisis. [more]
Scientists Find Alarming Deterioration In DNA Of The Urban Poor --The urban poor in the United States are experiencing accelerated aging at the cellular level, and chronic stress linked both to income level and racial-ethnic identity is driving this physiological deterioration. These are among the findings published this week by a group of prominent biologists and social researchers, including a Nobel laureate. Researchers analyzed telomeres of poor and lower middle-class black, white, and Mexican residents of Detroit. Telomeres are tiny caps at the ends of DNA strands, akin to the plastic caps at the end of shoelaces, that protect cells from aging prematurely. Telomeres naturally shorten as people age. But various types of intense chronic stress are believed to cause telomeres to shorten, and short telomeres are associated with an array of serious ailments including cancer, diabetes, and heart disease. Evidence increasingly points to telomere length being highly predictive of healthy life expectancy. Put simply, "the shorter your telomeres, the greater your chance of dying." The new study found that low-income residents of Detroit, regardless of race, have significantly shorter telomeres than the national average. "There are effects of living in high-poverty, racially segregated neighborhoods -- the life experiences people have, the physical exposures, a whole range of things -- that are just not good for your health," Geronimus said in an interview with The Huffington Post.
Scores of Scientists Raise Alarm About the Long-Term Health Effects of Cellphones - Are government officials doing enough to protect us from the potential long-term health effects of wearable devices and cellphones? Maybe not. A letter released today, signed by 195 scientists from 39 countries, calls on the United Nations, the World Health Organization (WHO), and national governments to develop stricter controls on these and other products that create electromagnetic fields (EMF). "Based on peer-reviewed, published research, we have serious concerns regarding the ubiquitous and increasing exposure to EMF generated by electric and wireless devices," reads the letter, whose signatories have collectively published more than 2,000 peer-reviewed papers on the subject. "The various agencies setting safety standards have failed to impose sufficient guidelines to protect the general public, particularly children who are more vulnerable to the effects of EMF." For decades, some scientists have questioned the safety of EMF, but their concerns take on a heightened significance in the age of ubiquitous wifi routers, the Internet of Things, and the advent of wearable technologies like the Apple Watch and Fitbit devices, which remain in close contact with the body for extended periods. Cellphones, among the most studied emitters of electromagnetic radiation, remain the standard for judging health risks. The federal Centers for Disease Control and Prevention maintains that "we do not have the science to link health problems to cell phone use." The WHO, on the other hand, classifies radio-frequency electromagnetic radiation (the type emitted by wifi routers and cellphones) as "possibly carcinogenic to humans" based on limited evidence associating cellphone use with an increased risk for glioma, a malignant type of brain cancer.
Women Apply an Average of 168 Chemicals on Their Bodies Every Day -- Is it any surprise that the lotions, soaps and other products we use to make ourselves look younger or “better” might contain a nasty slew of chemicals? If you’re unsure or want to understand what these chemicals can do to your health, a recent report in The Guardian would be a good place to start. The report says that although many of these chemicals might be harmless, others might be endocrine disruptors, carcinogens and neurotoxins. Women are particularly at risk since they use more personal products—such as makeup, anti-aging creams and hair products—compared to men. The report was based off research from the Environmental Working Group (EWG). The nonprofit survived about 2,300 people in the U.S., and found that the average woman uses 12 products containing 168 unique ingredients every day. The average man uses six products daily with 85 unique ingredients. By using these products, we might negatively impact our health.The organization also reported the following:
- 12.2 million adults—one of every 13 women and one of every 23 men—are exposed to ingredients that are known or probable human carcinogens every day through their use of personal care products.
- One of every 24 women, 4.3 million women altogether, are exposed daily to personal care product ingredients that are known or probable reproductive and developmental toxins, linked to impaired fertility or developmental harm for a baby in the womb or a child.
- These statistics do not account for exposures to phthalates that testing shows appear in an estimated three quarters of all personal care products but that, as components of fragrance, are not listed on product ingredient labels.
- One of every five adults are potentially exposed every day to all of the top seven carcinogenic impurities common to personal care product ingredients—hydroquinone, ethylene dioxide, 1,4-dioxane, formaldehyde, nitrosamines, PAHs and acrylamide. The top most common impurity ranked by number of people exposed is hydroquinone, which is a potential contaminant in products used daily by 94 percent of all women and 69 percent of all men.
Toxic plastic found in the world’s favorite fish – For the first time, plastic particles have been found in the stomachs of tuna and other fish that are a staple of the human diet. More than 18 percent of sampled bluefin, albacore, and swordfish caught in the Mediterranean Sea and tested in 2012 and 2013 carried levels of plastic pollution in their bodies, according to a study published in the journal Marine Pollution Bulletin. All three species migrate between the Mediterranean and the Atlantic Ocean, so these plastic particles could make their way onto the plates of American consumers. The plastics found in the fish contained phthalates, nonylphenol, bisphenol A, brominated flame retardants, and other chemicals that previous research has linked to endocrine disruption, low reproductive rates, and other health risks. A 2010 study by French and Belgian marine biologists estimated that 250 billion pieces of microscopic plastic were floating in the Mediterranean. A 2014 expedition by Gabriel Gorsky of Pierre-et-Marie Curie University found that “there is not one parcel of the Mediterranean Sea that is devoid of plastic or plastic fragments.” Another study published last year estimated that all of the world’s oceans combined carry more than 5 trillion pieces of plastic pollution. The current study of large pelagic fish (which live in the open sea, away from the shores or the bottom of the ocean) examined 56 swordfish, 36 bluefin, and 31 albacore that had been caught in the Mediterranean. Of those fish, seven swordfish, 11 bluefin, and four albacore contained plastics in their stomachs. The swordfish were more likely to have ingested large fragments of plastic, while the albacore ingested mostly microplastics.
House Passes Bill To Block EPA Proposal That Would Protect Millions Of Miles Of Streams -- The Republican-led House of Representatives passed a bill this week that would block a proposal by the Environmental Protection Agency (EPA) to clarify what streams, tributaries and wetlands can be protected under the Clean Water Act. The proposed Waters of the United States rule would help protect the one third of Americans who get their drinking water from sources that are currently without oversight, said EPA Administrator Gina McCarthy. Opponents said the proposed rule is regulatory overreach, and farm organizations voiced concern that the EPA would start checking up on agricultural ditches and seasonal puddles — bodies of water that are currently not regulated by the Clean Water Act. “In no way do we intend to reduce the exclusions or exemptions that are currently in the Clean Water Act,” McCarthy said at a hearing in February. “Our goal in this rule is very straightforward. It is to respond to requests from stakeholders across the country to make the process of identifying waters protected under the Clean Water Act easier to understand, to make it more predictable and more consistent with the law and peer-reviewed science.” The proposed Waters of the U.S. rule would offer protection to two million miles of streams and 20 million acres of wetlands. Right now, those areas are not clearly designated under the Clean Water Act.
Summer Honeybee Losses Spiked Last Year, And Researchers Aren’t Sure Why - Honeybees are still dying and disappearing in huge numbers in the U.S., and summertime losses of bees have surged, according to a new survey. The report, published Wednesday by the Bee Informed Partnership, Apiary Inspectors of America, and the U.S. Department of Agriculture (USDA), surveyed more than 6,100 beekeepers across the country on their experiences with bee losses over the last year. The survey found that, in total, beekeepers lost 42.1 percent of their bees from April 2014 to April 2015, though some states saw higher losses — Wisconsin and Maine beekeepers, for instance, lost an average of about 60 percent of their bees over the last year. The survey also had some other troubling findings: for the first time, bee colony losses in summer surpassed losses in winter. According to the survey, beekeepers reported summer losses of 27.4 percent — a surge compared to summer 2013’s losses of 19.8 percent. Winter losses for 2014-2015 were reported at 23.1 percent. According to the organizations involved in the research, losses of 18.7 percent are the maximum that beekeepers consider to be economically viable. The spike in summer losses is “extremely troubling,” said Dennis vanEngelsdorp, co-author of the report and assistant professor of entomology at the University of Maryland. “You expect colonies to die in the winter,” he told ThinkProgress, because cold temperatures and lack of flowers magnify bees’ stress. “You don’t expect them to die during the summer, which is paradise,” with its blooming flowers and abundance of pollen and nectar, he said. VanEngelsdorp said he and his team aren’t sure yet what’s causing the high bee losses in the summer, but thinks poor nutrition might be contributing to it. When meadows — which can contain a vast array of flowers that bees can forage from — get plowed under and replaced by crops like soybeans and corn, it can affect the total nutrition the bees in the surrounding area get. This is a problem especially in the Midwest, vanEngelsdorp said.
A Sharp Spike in Honeybee Deaths Deepens a Worrisome Trend - A prolonged and mysterious die-off of the nation’s honeybees, a trend worrisome both to beekeepers and to farmers who depend on the insects to pollinate their crops, apparently worsened last year.In an annual survey released on Wednesday by the Bee Informed Partnership, a consortium of universities and research laboratories, about 5,000 beekeepers reported losing 42.1 percent of their colonies in the 12-month period that ended in April. That is well above the 34.2 percent loss reported for the same period in 2013 and 2014, and it is the second-highest loss recorded since year-round surveys began in 2010.Most striking, however, was that honeybee deaths spiked last summer, exceeding winter deaths for the first time. Commercial beekeepers, some of whom rent their hives to farmers during pollination seasons, were hit especially hard, the survey’s authors stated.“We expect the colonies to die during the winter, because that’s a stressful season,” said Dennis vanEngelsdorp, an assistant entomology professor at the University of Maryland who directs the survey for the bee partnership. “What’s totally shocking to me is that the losses in summer, which should be paradise for bees, exceeded the winter losses.” Bees are not in danger of extinction, but their health is of major concern to agriculture, where honeybees’ pollination services are estimated to be worth $10 billion to $15 billion a year.Nobody knows with certainty why honeybee deaths are rising. Beekeepers once expected to lose perhaps 10 percent of their bees in an average year. But deaths began to spike in the middle of the past decade, when a phenomenon in which bees deserted their hives and died en masse, later named colony collapse disorder, began sweeping hives worldwide.Those mass die-offs have abated somewhat in recent years, experts say, but colonies remain in poor health, and overall death rates remain much higher than in the past.
U.S. Honeybee Population Plummets by More Than 40%, USDA Finds - The study was conducted by the Bee Informed Partnership in collaboration with the Apiary Inspectors of America and the United States Department of Agriculture (USDA). Preliminary results indicate that U.S. beekeepers were hardest-hit in the summer of 2014, with an average loss of 27.4 percent of their hives compared to the 19.8 percent the previous summer. While winter numbers improved about 0.6 percentage points less than the previous winter, the honeybee death rate is still too high for long-term survival. Colony losses were 23.1 percent for the 2014-15 winter months, which is normally the higher loss period. The Associated Press reported that the study’s entomologists were “shocked” when they noticed bees were dying more in the summer than the winter for the first time. Study co-author Dennis vanEngelsdorp of the University of Maryland told the news organization that seeing massive colony losses in summer is like seeing “a higher rate of flu deaths in the summer than winter. You just don’t expect colonies to die at this rate in the summer.” A growing body of evidence has pointed to one class of pesticides in particular, neonicotinoids, as the culprit to the massive bee die-offs. In fact, the European Union banned the three most widely used neonicotinoids in 2o13, but they are still used widely in the U.S. Environmental advocacy organization Friends of the Earth noted that the extreme bee losses highlight the urgent need to restrict pesticides to protect pollinators. “Bayer, Syngenta and Monsanto make billions from bee-killing pesticide products while masquerading as champions of bee health,” said Tiffany Finck-Haynes, food futures campaigner with Friends of the Earth.
Egg Farms Hit Hard as Bird Flu Affects Millions of Hens - — Mr. Dean, a son of the founder of one of the country’s biggest egg producers, the Center Fresh Group, must kill and dispose of about 5.5 million laying hens housed in 26 metal barns that rise among the rolling corn and soybean fields here. Deadly avian flu viruses have affected more than 33 million turkeys, chickens and ducks in more than a dozen states since December. The toll at Center Fresh farms alone accounts for nearly 17 percent of the nation’s poultry that has either been killed by bird flu or is being euthanized to prevent its spread.While farmers in Asia and elsewhere have had to grapple with avian flu epidemics, no farmers in the United States have ever confronted a health crisis among livestock like this one, which seemed to travel along migratory bird pathways from the Pacific Northwest to the Midwestern states. Almost every day brings confirmation by the Agriculture Department that at least another hundred thousand or so birds must be destroyed; some days, the number exceeds several million.On Thursday, South Dakota reported its first possible infection on a chicken farm with 1.3 million birds in the eastern part of the state.Mounds and mounds of carcasses have piled up in vast barns here in the northwestern corner of Iowa, where farmers and officials have been appealing for help to deal with disposal of such a vast number of flocks. Workers wearing masks and protective gear have scrambled to clear the barns, but it is a painstaking process. In these close-knit towns farmers have resorted to burying dead birds in hurriedly dug trenches on their own land, while officials weighed using landfills and mobile incinerators.
Are We Headed for an Egg Shortage? - The cost of breaker eggs -- those cracked and sold in liquid form for use by wholesale bakers and restaurants such as McDonald’s Corp. -- have more than doubled in the past three weeks. The culprit behind the surge: the worst-ever American outbreak of the bird flu virus. More than 33.5 million chickens, turkeys and other birds have been affected. Iowa, the top U.S. egg producer, was hardest hit, losing 40 percent of its laying hens. The disease prompted the government to forecast the first annual drop in egg production since 2008. Greco is concerned his 4,200-pound (1,900-kilogram) stash of liquid eggs won’t protect him from higher costs, and that he’ll have to start buying eggs still in shells to crack by hand. He’s been racing to buy extra supplies over the past month and saw prices for the pails of liquid eggs he buys jump 28 percent last week. Highly pathogenic avian influenza spread rapidly through parts of the Midwest in the past two months, and Iowa lost about 23 million hens. Post Holdings Inc. has warned that bird flu will hurt fiscal 2015 earnings at its food-service unit, while countries in the Middle East and Asia have placed restrictions on shipments of U.S. poultry. The U.S. Department of Agriculture on Tuesday said that domestic egg production will drop this year, reversing an April forecast for an increase. Bird flu will also limit turkey supplies, though they’re still expected to climb from 2014. Total annual poultry and egg output is valued at about $48 billion.
Troubling new research says global warming will cut wheat yields - “Wheat is one of the main staple crops in the world and provides 20% of daily protein and calories,” notes the Wheat Initiative, a project launched by G20 agricultural ministers. “With a world population of 9 billion in 2050, wheat demand is expected to increase by 60%. To meet the demand, annual wheat yield increases must grow from the current level of below 1% to at least 1.6%.” That’s why the punchline of a new study in the Proceedings of the National Academy of Sciences is pretty troubling. A warming climate, it suggests, could drive wheat yields in the opposite direction – down — in the United States and, possibly, elsewhere. “The net effect of warming on yields is negative,” write Jesse Tack of the agricultural economics department of Mississippi State University and two colleagues, “even after accounting for the benefits of reduced exposure to freezing temperatures.” That’s no small matter, the study notes, in that wheat is “the largest source of vegetable protein in low-income countries.” The study compared results from nearly 30 years of winter wheat trials across Kansas — a state that produced $2.8 billion worth of wheat crop in 2013 — with data on weather and precipitation. Winter wheat grows from September to May and faces two major temperature-related threats during this cycle — extreme winter cold, and extreme spring heat. Global warming ought to cut down on the freezing temperatures, but also amp up really hot ones. The study found, however, that on balance, the effect is more negative than positive, with a roughly 15 percent decline in wheat yields under a 2 degrees Celsius warming scenario, rising to around 40 percent with 4 degrees (C) of warming.
World population-food supply balance is becoming increasingly unstable, study finds: Researchers report that as the world population increases and food demand has grown, globalization of trade has made the food supply more sensitive to environmental and market fluctuations. This leads to greater chances of food crises, particularly in nations where land and water resources are scarce and therefore food security strongly relies on imports. The assesses the food supply available to more than 140 nations (with populations greater than 1 million) and demonstrates that food security is becoming increasingly susceptible to perturbations in demographic growth, as humanity places increasing pressure on use of limited land and water resources. "In the past few decades there has been an intensification of international food trade and an increase in the number of countries that depend on food imports," said Paolo D'Odorico, a professor of environmental sciences at the University of Virginia and one of the study's authors. "On average, about one-fourth of the food we eat is available to us through international trade. This globalization of food may contribute to the spread of the effects of local shocks in food production throughout the world." D'Odorico's paper is published this week in the online early edition of the journal Proceedings of the National Academy of Sciences. Food security, D'Odorico said, is typically defined as the availability of and access to a sufficient amount of food to meet the requirements of human societies at all places and all times. "In order to have food security, food availability and accessibility need to be sustainable and resilient to perturbations associated with shocks in production and price spikes," he said. "We're finding that as the globalization of food increases, the coupled population/food system becomes more fragile and susceptible to conditions of crisis."
Monsanto’s Covert War on European Food Security -- Working quietly on the back of political turmoil driven by Western special interests (including itself) Monsanto has begun literally planting the seeds of genetically modified organisms’ spread throughout Europe, starting in Ukraine and working westward toward the European Union thanks to a slowly but surely softening by regulators regarding GMOs, despite their widespread unpopularity.Regarding this American biotech company and others like it, and their attempts to infest the planet with genetically modified organisms (GMOs), and in particular their attempts to corrupt the whole of Europe with their unwanted poison through a backdoor (Ukraine), has prompted Russia to speak up for their Eastern European neighbor. Up until the armed coup in 2013-2014, also known as the “Euromaidan,” Ukraine had adamantly rejected GMOs. With an obedient client regime now installed in Kiev, a series of political, economic and military decisions have been made that have more or less extinguished Ukraine as a sovereign nation state. Along with its extinguished sovereignty comes a complete lack of desire for self-preservation, and so, sowing one’s fields with genetically tainted, unsafe, literal poison goes from being adamantly avoided, to being openly embraced. This brings us back to the Washington Post and a recent editorial it has published. Titled, “Russia says Western investment in Ukraine’s farms is a plot to take over the world,” it first attempts to make Russia’s accusations that Monsanto is now moving in on Ukraine with plans to institute GMOs nationwide sound unfounded. That is until the Post itself admits that is precisely what Monsanto is doing.
Farmers worry over reach of EPA water rules — Government rules to clarify which streams, tributaries and wetlands should be protected from development and pollution are fueling political anger in the country’s heartland. The Environmental Protection Agency rules proposed last year have become a top issue of concern for many farmers and landowners who say there are already too many government regulations that affect their businesses. The EPA says its water rules simply clarify — and don’t expand — what smaller bodies of water are regulated under the Clean Water Act. Some lawmakers say it’s overreach that is aggravating longstanding trust issues between rural areas and the federal government. In response to that frustration, the House will consider a bill Tuesday that would withdraw the rule and force the EPA to further consult with state and local officials before rewriting it. The rule would “trample on private property rights and hold back our economy,” read a memo sent out by the office of House Majority Leader Kevin McCarthy, R-Calif., before the House floor debate. The White House has threatened to veto the legislation. A bipartisan group of senators introduced a bill last month that would force the EPA to rewrite the rules by the end of next year. “We’ve got a whole lot of pent-up frustration and concern because it seems like every time they turn around, there is a new set of regulations for farmers to be concerned about,” says North Dakota Sen. Heidi Heitkamp, a Democrat who is backing the Senate bill. Heitkamp, narrowly elected in a competitive Senate race in 2012, says it’s the number one issue she hears about from farmers. “It’s the perfect example of the disconnect between Washington and rural areas,”
Is there a need for the “farm income safety net”? --In 2015 alone, farmers will receive about $18 billion in the form of direct taxpayer funded subsidies. In a detailed examination of what is commonly called “farm income safety net” payments, agricultural economist and American Enterprise Institute scholar Vincent H. Smith takes a look at these benefits including: federal crop price support, crop and dairy income support, and crop and livestock insurance programs. Defenders of the Farm Bill often argue that farming is a financially risky business with volatile prices and thus farmers need to be protected — but is this really the case? On average, the top fifteen percent of all farmers receive 85 percent of farm subsidy payments and enjoy incomes of hundreds of thousands of dollars. In his latest piece in the Washington Examiner, Smith examines and explains the pitfalls of this enormous “farm income safety net.” Smith concludes that: “It is . . . feasible . . . to develop well-structured permanent disaster aid programs that would trigger reasonable payments to farmers in areas where extreme weather has genuinely devastated their operations…This type of disaster aid program would help farms only when they genuinely face extreme production losses that occur rarely (not daily or annually). The program would cost taxpayers about twelve billion dollars a year less than the current plethora of handout programs that mainly benefit wealthy farmers and landowners. This would amount to a real farm income safety net reform at less than one third of the cost of the current wasteful and poorly targeted federal farm subsidy program.”
In Wyoming, Taking A Photo Of A Polluted Stream Could Land You In Jail - To some, Wyoming’s Senate Bill 12 — otherwise known as the Data Trespass Bill — is merely a deepening of preexisting trespass laws — a way for private landowners to seek recourse from individuals trespassing on their property to collect data. To others, the law is nothing short of an unconstitutional ban on citizen science throughout the state. Passed by the Wyoming state government and signed into law by Gov. Matt Mead (R) in March, the law makes it illegal to “collect resource data” from any land outside of city boundaries, whether that land be private, public, or federal. Under to the law, “collect” means to “take a sample of material, acquire, gather, photograph or otherwise preserve information in any form from open land which is submitted or intended to be submitted to any agency of the state or federal government.” Imagine, for a second, a hiker who is taking a walk through a national forest in Wyoming. During that hike, she notices a visibly polluted stream within the area. The next day, she returns with a camera to take a picture of the stream, with the intention of showing those photographs to the local authorities as proof of pollution. Under the Data Trespass Bill, unless the hiker obtained specific permission from the land’s owner or manager — in this case, the Forest Service — to collect that data, she would be subject to prosecution that could result in up to $5,000 in fines and a year in prison. And while the law probably won’t be used to slap fines on every Yellowstone tourist with a camera, it does have broad-reaching implications for environmental data collection in the state, according to Justin Pidot, an assistant professor at the University of Denver Sturm College of Law, who wrote a piece on the law for Slate. “People on the ground, who have been engaged in this kind of data collection in the past, now have to face the worry about being potentially prosecuted,” Pidot told ThinkProgress. “The chilling effect on citizen participation is huge.”
Wyoming’s War on Microbiology: Well, they’re not calling it that, but this Wyoming law is definitely not going to make our water cleaner, or stop the spread of antibiotic resistance genes...: …the new law makes it a crime to gather data about the condition of the environment across most of the state if you plan to share that data with the state or federal government. The reason? The state wants to conceal the fact that many of its streams are contaminated by E. coli bacteria, strains of which can cause serious health problems, even death. ... Rather than engaging in an honest public debate about the cause or extent of the problem, Wyoming prefers to pretend the problem doesn’t exist. And under the new law, the state threatens anyone who would challenge that belief by producing information to the contrary with a term in jail... The new law is of breathtaking scope. It makes it a crime to “collect resource data” from any “open land,” meaning any land outside of a city or town, whether it’s federal, state, or privately owned. The statute defines the word collect as any method to “preserve information in any form,” including taking a “photograph” so long as the person gathering that information intends to submit it to a federal or state agency. In other words, if you discover an environmental disaster in Wyoming, even one that poses an imminent threat to public health, you’re obliged, according to this law, to keep it to yourself.
U.S. Food Policy: What crops to grow in California?: In drought-ridden California, 80% of managed water supplies are used for agriculture. You might think that California must consider severe cuts in agricultural production to conserve water. That would be painful, because agriculture is important to California. Just for starters, think of all the farmers and farm-workers whose livelihoods depend on agriculture. Fortunately, it would be possible for California to reduce water use by a lot while reducing total agriculture production by just a little. A new brief (.pdf) from Heather Cooley at the Pacific Institute has two highly relevant figures. Figure 2 shows that alfalfa is responsible for the most total water use (5.2 million acre-feet). Rice (ranked fourth) and corn (ranked sixth) are also major drinkers of total water. Figure 2. Applied Water for California Crops in 2010. Source: Cooley (2015). Data: CA Department of Water Resources. Figure 5 shows that these same three crops -- alfalfa, rice, and corn -- offer the lowest agricultural value per unit of water consumed ($ per acre-foot).Though Cooley's accompanying narrative makes the point exceedingly gently, this report has an important implication. If California agriculture reduced water use in alfalfa, rice, and corn by a large volume (in millions of acre-feet statewide), the value of agricultural production in California would fall by a comparatively small amount (in millions of dollars statewide). Alfalfa and corn are important animal feeds in California, so this change would require dairies and meat producers to bring in feed from other states, or reduce their own production. Yet, that could make more sense than growing water-intensive animal feeds in a dry state.
California drought rules frustrate regions that prepared for the worst - In California’s second-largest city, memories are still fresh of a devastating drought 25 years ago that saw the area’s water supplies slashed by about a third. Billions of dollars were invested to prepare for the next drought, an effort that included building the western hemisphere’s largest desalination plant, which opens this fall. Yet the moves count for nothing under sweeping statewide cuts to urban water use approved this week that require hundreds of cities, counties and local agencies to reduce consumption between 8% and 36% from 2013 levels, starting 1 June. The largest per-capita users must make the biggest percentage cuts, no matter how and where they get their water. San Diego isn’t the only place complaining. The Orange County Water District, which serves 2.4 million people near Los Angeles, wanted credit for sending wastewater through ground basins for drinking. It started recycling water in 2008 and is boosting production to 100m gallons a day from 70m. San Diego, which imports nearly all of its water, launched its quest for water independence in 1991, after the Metropolitan Water District of Southern California said it was cutting deliveries in half. Metropolitan, a giant wholesaler based in Los Angeles, supplied 95% of San Diego’s water at the time. Surprise rains reduced the cut to 31%, which lasted 13 months. Still, businesses led by the city’s biotech industry demanded change.
East Bay MUD customers to experience bad smell in tap water -- The California drought is causing East Bay Municipal Utility District or EBMUD to switch its water supply source and there could be some complaints. A bad taste and smell in tap water will affect at least 1.3 million East Bay water customers in a few days. EBMUD spokesperson Abby Figueroa says the agency is starting to pump warmer water from Pardee Dam in the Sierra at higher depths to save colder water down below for fisheries downstream. "Consequently, what happens is that the water that's going to be coming into the East Bay, starting in a few days because it takes a few days to flow in, is going to be warmer, more sunlit and water like that typically has more algae in it," she said.
San Jose to face mandatory water rationing with monthly allotments - -- In a dramatic sign of the increasing severity of California's drought, Silicon Valley's largest water company will impose mandatory water rationing on 1 million people next month, marking the first time in more than 20 years that South Bay residents will be given monthly water allotments and face fines if they exceed them. The water rationing plan, unveiled late Monday by the San Jose Water Company, will make San Jose the largest city in California so far to embrace strict rationing as the drought drags into its fourth year. Under the rules, every business and homeowner in San Jose Water Company's service area will be given a month-by-month water allocation, based on the average amount used in 2013 by all the company's customers. Customers must reduce water use 30 percent from that two-year-old average. The plan will take effect in mid-June if approved by the state Public Utilities Commission, as expected, and will affect the 80 percent of San Jose's residents whose water is provided by San Jose Water, a privately held firm that was founded in 1866. The rules also apply to the company's customers in Los Gatos, Saratoga, Monte Sereno, Campbell and parts of Cupertino.
Water Wars Officially Begin In California - A century of government meddling has turned the issue of water rights on its head, and further centralized control of waterways in local, state, and federal governments; and, as Acuweather reports, with the state of California mired in its fourth year of drought and a mandatory 25% reduction in water usage in place, reports of water theft are becoming increasingly common. With a stunning 46% of the state in 'exceptional' drought, and forecast to worsen, huge amounts of water are 'going missing' from the Sacramento-San Joaquin Delta and a state investigation was launched. From illegally tapping into hydrants in order to fill up tanks to directly pumping from public canals, California continues to formulate new strategies to preserve as much water as possible and fight the new water wars that are emerging. Homeowners in Modesto, California, were fined $1,500, as Accuweather reports, for allegedly taking water from a canal. In another instance, thieves in the town of North San Juan stole hundreds of gallons of water from a fire department tank. In Madera County, District Attorney David Linn has instituted a water crime task force to combat the growing trend of water theft occurring throughout the state and to protect rightful property owners from having their valuable water stolen.
Nestlé CEO On Bottling Water In California: ‘If I Could Increase It, I Would’ -- You probably heard that there’s a drought in California. You might have heard that food and beverage mega-corporation Nestlé (as well as lots of other companies) is bottling water in the drought in California. This is not Nestlé’s fault. This is your fault. At least, that’s what Nestlé International Waters’ CEO seemed to be saying in an interview with Southern California Public Radio this week. “If I stop bottling water tomorrow, people would buy another brand of bottled water,” Tim Brown said. “It’s driven by consumer demand, it’s driven by an on-the-go society that needs to hydrate.” Nestlé came under attack last month, when it was revealed that the company has been bottling water from the San Bernardino National Forest under an expired permit for the past 25 years. The company has repeatedly said that its expired permit with the National Forest Service remains in good standing. “We feel good about what we’re doing,” Brown said. “In fact, if I could increase it, I would.”
How Wal-Mart Makes An Instant 65,724% Profit Selling... California Water - Wal-Mart is facing questions tonight after CBS13 learns the company draws its bottled water from a Sacramento water district during California’s drought. According to its own labeling, the water in the gallon jugs appears to come from Sacramento’s water supply. Sacramento sells water to a bottler, DS Services of America, at 99 cents for every 748 gallons—the same rate as other commercial and residential customers. That water is then bottled and sold at Walmart for 88 cents per gallon, meaning that $1 of water from Sacramento turns into $658.24 for Walmart and DS Services.– From the CBS News in Sacramento article: Wal-Mart Bottled Water Comes From Sacramento Municipal Supply We all know there’s a severe drought plaguing much of California. I haven’t focused on this topic much, but I did publish a very powerful post on it last fall titled: Video of the Day – Stunning Scenes from California’s Central Valley Drought. Now we learn of some pretty troubling news that Wal-Mart is sourcing some of its bottled water from the Sacramento water supply, despite the fact that: “Sacramento-area water districts are preparing to enforce residential water-use cuts as high as 36 percent.” As we all know, you should never let a historic drought get in the way of corporate profit margins; and these appear to be some really nice margins. We learn from CBS News in Sacramento that: Sacramento sells water to a bottler, DS Services of America, at 99 cents for every 748 gallons—the same rate as other commercial and residential customers. That water is then bottled and sold at Walmart for 88 cents per gallon, meaning that $1 of water from Sacramento turns into $658.24 for Walmart and DS Services.
Colorado River water shortage in 2016 more likely - California’s drought emergency woes have worsened, with a shortage on the Colorado River next year becoming increasingly likely. Odds of a shortage rose from 33 percent to 50 percent from April 1 to May 1, Metropolitan Water District, Southern California’s largest water wholesaler, said Monday. Also Monday, a Metropolitan committee also unsuccessfully considered a proposal to spend an extra $150 million on water conservation projects, such as paying to replace grass with low water-use landscaping. The committee unexpectedly deadlocked, with some members, including San Diego representatives, objecting to the cost. The full Metropolitan board will take up the proposal Tuesday. Southern California get nearly all of its water from the Colorado and from Northern California. Both sources are severely strained. This year, Metropolitan is getting just 20 percent of contracted supplies from Northern California.On the Colorado, Lake Mead, the reservoir with the largest capacity in the United States, is 38 percent full, the lowest since it was first filled in the 1930s. So any shortage of Colorado River water would be especially painful. The agency supplies 19 million people in Southern California, including San Diego County. Metropolitan’s estimate of a Colorado shortage is unofficial, with official numbers expected next week, said Bob Muir, a Metropolitan spokesman.
Record low water levels predicted for Lake Mead - -- California may be dealing with a statewide drought, but judging by a meeting held Tuesday by the Colorado River Commission, it looks like Nevada is the state that's in trouble. A report released Tuesday predicts record lows for Lake Mead and Lake Powell, which is where the state gets 90 percent of its water. The water Nevada receives from the Colorado River also isn't helping much, and a lot of that has to do with the water rules that were established in the last century. "We get the least allocation of the Colorado River, and that is based on treaties that are a century old and that's never going to change," said Clark County Commissioner Steve Sisolak. The treaty didn't account Nevada's population growth. Even though Nevada's population has exploded in the past 30 years, the state only gets a 1.8 percent share of the water. Nevada shares water with six other states and Mexico, but only so much is allocated. Compared to the other states and Mexico using the water from the Colorado River, Nevada has to do more with less. Then the allocated water is set up into two groups and distributed throughout the state. Most of it goes to residential customers, but the rest of the water is split between commercial and industrial companies for golf courses, resorts, schools, and parks. The lack of snowfall in the Rockies has also added to the water issues around the state.
Arizona water shortages loom: The state prepares for rationing as Lake Mead hits record low. -- Last week, Lake Mead, which sits on the border of Nevada and Arizona, set a new record low—the first time since the construction of the Hoover Dam in the 1930s that the lake’s surface has dipped below 1,080 feet above sea level. The West’s drought is so bad that official plans for water rationing have now begun—with Arizona’s farmers first on the chopping block. Yes, despite the drought’s epicenter in California, it’s Arizona that will bear the brunt of the West’s epic dry spell. The huge Lake Mead—which used to be the nation’s largest reservoir—serves as the main water storage facility on the Colorado River. Amid one of the worst droughts in millennia, record lows at Lake Mead are becoming an annual event—last year’s low was 7 feet higher than this year’s expected June nadir, 1,073 feet. If, come Jan. 1, Lake Mead’s level is below 1,075 feet, the U.S. Bureau of Reclamation, which manages the river, will declare an official shortage for the first time ever—setting into motion a series of already agreed-upon mandatory cuts in water outlays, primarily to Arizona. (Nevada and Mexico will also receive smaller cuts.) The latest forecasts give a 33 percent chance of this happening. There’s a greater than 75 percent chance of the same scenario on Jan. 1, 2017. Barring a sudden unexpected end to the drought, official shortage conditions are likely for the indefinite future. Why Arizona? In exchange for agreeing to be the first in line for rationing when a shortage occurs, Arizona was permitted in the 1960s to build the Central Arizona Project, which diverts Colorado River water 336 miles over 3,000 feet of mountain ranges all the way to Tucson. It’s the longest and costliest aqueduct in American history, and Arizona couldn’t exist in its modern state without it. Now that a shortage is imminent, another fundamental change in the status quo is on the way. As in California, the current drought may take a considerable and lasting toll on Arizona, especially for the state’s farmers.
Washington governor declares statewide drought emergency - (AP) - The governor declared a statewide drought emergency on Friday, clearing the way for Washington state officials to ramp up aid to deal with hardships from water shortages. Gov. Jay Inslee said parts of the state have been severely impacted by snowpack levels that have reached just 16 percent of normal. “This drought has deepened dramatically over the past few weeks,” Inslee said, noting the snowpack was at an unprecedented low. State agriculture officials estimated a loss of $1.2 billion in crops this year because of dry conditions. And state wildfire managers expected blazes earlier than normal in the season and at higher elevations. “The rain the past few days is bringing some temporary relief, however with no snow in the mountains to sustain us through the dry summer months, we have some really tough months ahead of us,” said Maia Bellon, director of the state Department of Ecology. Some water managers in the Puget Sound region, including Seattle, Tacoma and Everett, aren’t anticipating water shortages.
The Greatest Water Crisis In The History Of The United States -- Thanks to the worst drought in more than 1,000 years, the western third of the country is facing the greatest water crisis that the United States has ever seen. Lake Mead is now the lowest that it has ever been since the Hoover Dam was finished in the 1930s, mandatory water restrictions have already been implemented in the state of California, and there are already widespread reports of people stealing water in some of the worst hit areas. But this is just the beginning. Right now, in a desperate attempt to maintain somewhat “normal” levels of activity, water is being pumped out of the ground in the western half of the nation at an absolutely staggering pace. Once that irreplaceable groundwater is gone, that is when the real crisis will begin. If this multi-year drought stretches on and becomes the “megadrought” that a lot of scientists are now warning about, life as we know it in much of the country is going to be fundamentally transformed and millions of Americans may be forcedto find somewhere else to live. Simply put, this is not a normal drought. In fact, scientists tell us that California has not seen anything quite like this in at least 1,200 years… Much of the state of California was once a desert, and much of it is now turning back into a desert. The same thing can also be said about much of Arizona and much of Nevada. We never really should have built massive, sprawling cities such as Las Vegas and Phoenix in the middle of the desert. But the 20th century was the wettest century for western North America in about 1,000 years, and we got lulled into a false sense of security.
Experts: recent rains end worst of years-old Texas drought - — Recent heavy rains have helped Texas emerge from the worst of the years-long drought. The U.S. Drought Monitor on Thursday indicated Texas, for the first time since mid-2012, is no longer in the “exceptional drought” category. That’s the most dire of five drought designations on the weekly map by federal agencies. The drought has ravaged parts of Texas since 2011. Sections of the state were still listed Thursday as abnormally dry or in moderate, severe or extreme drought. The Houston area received more than 10 inches of rain this week. Corsicana last weekend was doused with 11 inches of rain. Drought-stricken Wichita Falls reports lakes that help supply the city’s water continue to rise due to recent storms. Combined levels for Lake Arrowhead and Lake Kickapoo topped 50 percent Tuesday.
Historic water crisis in São Paulo ‘has come to stay. You have to look at it as permanent.’ – Instead of rain, São Paulo has cracked earth and chaos as a devastating drought is making enemies out of neighbors in Brazil’s largest city, the site of a historic water shortage the likes of which hasn’t been seen in decades. Many residents have gone to drastic measures to hoard the precious commodity in the face of tougher water use restrictions, pinched faucets and declining reservoirs. Local authorities fearing anarchy in the city of 11 million are considering bringing in the military to control what’s quickly spiraling into a war over resources. São Paulo’s water crisis that began last year is the region’s worst drought in more than 80 years. Brazil is home to roughly 12 percent of the world’s fresh water, yet millions of residents in the country’s most populated metropolis have gone days on end without running water, according to the Guardian. The drought is the result of three consecutive years of record low rainfall, which the city relies on to replenish its depleted reservoirs. Today, the city’s reservoirs are at just 27 percent capacity, down from 40 percent in May 2014. Other reservoirs that aren’t at dangerously low levels are too polluted for human use. Arguments have broken out among some water-strapped residents living in the city’s crowded apartment buildings in the midst of water rationing, Claire Other city dwellers whose water was turned off for large chunks of the day took to the streets in February to protest the government turning off their taps. Leaders met last week to discuss handling São Paulo’s worsening water crisis, with some raising concerns over a collapse in social order as residents become increasingly desperate. Resource experts say the problem will likely have consequences for years to come. “You have to think about the way of dealing with a crisis that has not just come in the short range, but has come to stay,” water expert Pedro Jacobi of the University of São Paulo told Circle of Blue. “You have to look at it as permanent." [more]
Brazilian Ranchers Aren’t Cutting Down As Much Forest Anymore. Here’s Why. --Preure from environmental groups and federal prosecutors is helping break the link between cattle ranching and deforestation in the Amazon, according to a new study. Agreements with Brazil’s largest slaughterhouses have “dramatically” reduced deforestation by ranchers, research published Tuesday in Conservation Letters found. Supply chain solutions — such as the market-driven agreements Brazilian beef companies entered into with Greenpeace and the Brazilian government in 2009 — are remarkably effective and have rapidly changed deforestation behavior for beef suppliers, said Holly Gibbs, a professor at the Center for Sustainability and the Global Environment at the University of Wisconsin-Madison and an author of the study. Both 2009 agreements committed companies to only sourcing beef from ranchers who were not engaging in deforestation. The agreements have been “exceptionally influential,” Gibbs told ThinkProgress. When JBS, one of Brazil’s biggest beef producers, signed the agreements, only 2 percent of its suppliers were registered as zero-deforestation. By 2013, nearly all were, the researchers found. The reasoning is simple: “If you don’t comply with the agreement, you won’t have access to the market,”
Mega-Dam Projects Will Force Tens of Thousands of People From Their Land - In the Malaysian state of Sarawak in the north of the island, mega-hydro projects are driven by the state government through the Sarawak Corridor of Renewable Energy, or SCORE. If built, these dams will force tens of thousands of people from their land, drive untold species to extinction, pollute the rivers—the lifelines of the jungle—and produce more greenhouse gas emissions per megawatt of energy than a coal-fired power plant. The government of Sarawak has already built two dams in the proposed SCORE portfolio, but local resistance has stalled progress on the next dams scheduled to flood the forest. Since October 2013, indigenous communities in Malaysian Borneo have prevented construction of the Baram mega-dam, which would forcefully displace thousands of families. As part of the campaign to stop the Sarawak dams, The Borneo Project, a U.S.-based nongovernmental organization, has released Commerce or Corruption?, the second film in a series of short documentaries exposing the realities of proposed mega-dam construction in Sarawak. The film release coincides with the 555th day of the Baram Dam blockades. The damage inflicted by these dams would be massive, and the benefits are still unclear. Given that there is no sound reason to build these dams, the question becomes, why are these dams being built, and why now? Commerce or Corruption? exposes the government’s true motivation behind the dams: personal financial gain. Private companies involved in construction and transmission stand to make gigantic profits from building the dams. Many of these companies are controlled by relatives and friends of the governor of the state, Taib Mahmud. Mahmud has been in power since the 1970s. Doling out the contracts would add even more gold to the already over-flowing coffers of politicians and their well-connected family members.
All-Time May Heat Record for Europe Falls For the 2nd Time This Month - An extreme May heat wave unprecedented in European recorded history has invaded Spain and Portugal, bringing the hottest May temperatures ever recorded on the continent. According to the Spanish meteorological agency, AEMET, at least four stations in the Valencian Community of eastern Spain hit temperatures today in excess of the previous European May heat record set just eight days ago--a 41.9°C (107.4°F) reading at Catenanuova, Sicily (Italy) on May 6. Today's European record-breaking May temperatures in Spain included:
Carcaixent: 42.9°C (109.2°F)
Xativa: 42.7°C (108.9°F)
Algemesi: 42.6°C (108.7°F)
Valencia: 42.6°C (108.7°F)
Many stations in Spain's Valencian community went above their June records, and were near their all-time records for any month. The record set at Valencia Airport today was 6.6°C (11.9°F) above the previous highest May temperature, was 4.4°C (7.9°F) higher than the record for June, and was the 3rd hottest temperature since records began in 1869 for any month! This week's heat wave began yesterday, when hot air from North Africa flowed northwards over Spain and Portugal, setting all-time May heat records at Madrid, Sevilla, Cordoba, Ciudad Real, Granada, and many other cities. Portugal beat its all-time May heat record with a 40.0°C (104.0°F) reading at Beja EMA (old record: 39.5°C, 103.1°F, at Regua on May 28, 2001.) The most remarkable record yesterday, however, was from the Canary Islands to the southwest of Spain, where Lanzarote Airport hit 42.6°C (108.7°F), breaking its old record for the entire month of May by 6°C (10.8°F)! The old record was 36.6 °C (97.9°F) on May 24, 1986.
You Just Lived Through The Earth's Hottest January-April Since We Started Keeping Records --It’s increasingly likely that 2015 will be the hottest year on record, possibly by a wide margin. NASA reported Wednesday that this was the hottest four-month start (January to April) of any year on record. This was also the second-warmest March on record in NASA’s dataset. The National Oceanic and Atmospheric Administration (NOAA) has just predicted a 90 percent chance that the El Niño it declared in March will last through the summer and “a greater than 80 percent chance it will last through 2015.” El Niños generally lead to global temperature records, as the short-term El Niño warming adds to the underlying long-term global warming trend. And in fact, with April, we have once again broken the record for the hottest 12 months on record: May 2014 – April 2015. The previous record was April 2014 – March 2015, set last month. The record before that was March 2014 – February 2015. And the equally short-lived record before that was February 2014 – January 2015. As we keep breaking records in 2015, our headlines are going to sound like a … broken record. May has already started out hot, and it is quite likely next month we will report “The Hottest 5-Month Start Of Any Year On Record,” and that June 2014 – May 2015 will become hottest 12 months on record.
Aussie scientists declare El Nino onset, forecast 'substantial' weather extremes - Australian scientists Tuesday forecast a “substantial” El Nino weather phenomenon for 2015, potentially spelling deadly and costly climate extremes, after officially declaring its onset in the tropical Pacific. El Nino had been expected last year when record-breaking temperatures made 2014 the hottest in more than a century. The Australian Bureau of Meteorology said while the thresholds were not met until now it was expected to be a significant event. The Japan Meteorological Agency also confirmed the phenomenon had begun and forecast it would continue into late 2015. “There’s always a little bit of doubt when it comes to intensity forecasts, but across the models as a whole we’d suggest that this will be quite a substantial El Nino event,” David Jones, from the bureau’s climate information services branch, said. “Certainly the models aren’t predicting a weak event. They are predicting a moderate-to-strong El Nino event. So this is a proper El Nino event, this is not a weak one or a near miss as we saw last year.” The El Nino phenomenon — which is associated with drought conditions in Australia — can cause havoc for farmers and global agricultural markets, hitting economies heavily dependent on the land. The last El Nino five years ago had a major impact with monsoons in Southeast Asia, droughts in southern Australia, the Philippines and Ecuador, blizzards in the United States, heatwaves in Brazil and killer floods in Mexico.
The rise and rise of the 2015 El Niño -- The Bureau of Meteorology has officially declared that we are in an El Niño, shifting its tracker from ALERT (a greater than 70% chance of El Niño forming) to an actual event. Speculation began in early 2014 that the world would see an El Niño, possibly a significant “super” event, by the end of that year. However the event development hit a few setbacks, and many thought the El Niño was already dead. In March this year, US National Oceanic and Atmospheric Administration officially declared that the “most-watched” 2014-15 El Niño had finally arrived. Now our own Bureau has followed suit. So what’s going on? And how severe could the 2015-16 El Niño turn out to be? El Niño usually develops over the southern autumn-winter, peaks around Christmas, and decays in the southern autumn. So this event is unusual as an El Niño would generally be decaying by this time of the year, but observations over recent weeks show otherwise. Sea surface temperatures in the El Niño core region (eastern equatorial Pacific) are actually still warming and the pattern is now looking more like a classic El Niño. In fact, the warm anomaly over the eastern equatorial Pacific – the typical indicator for an El Niño – has in the past three weeks exceeded 1C. Assuming this El Niño peaks at Christmas of 2015, this recent 1C temperature anomaly is unprecedented during the autumn of all developing El Niño years since at least the early 80s.
El Nino arrives in the Pacific Ocean and its effects could be 'substantial' – but what does it mean for the UK and the rest of the world? - The extreme weather system known as El Nino has begun, scientists say, and is forecast to be a “substantial” and lasting phenomenon with severe implications for either side of the Pacific Ocean. The Australian Bureau of Meteorology, which monitors weather patterns across the tropical Pacific, upgraded its monitoring status to El Nino level for the first time in five years, and warned it is “likely to persist in the coming months”. El Nino was expected amid record temperatures around the world last summer, but never fully materialised. Now, its arrival has been confirmed by the Japanese Meteorological Agency and US scientists at the NOAA, who predicted seemingly erroneously that it would be a “weak” event in early March. David Jones, climate monitoring and prediction chief at the Australian bureau, told reporters on Tuesday that this year’s effect will be “a proper El Nino, not a weak one”.He said that while there was always an area of doubt with forecasts of intensity, “across the models as a whole we’d suggest this will be quite a substantial El Nino event”. El Nino is famous around the world for causing a range of extreme weather events from droughts to flooding, blizzards and vast tropical storms. The Independent’s environment editor Tom Bawden explains what it is – and who should be worried.
El Niño near-certain to last through summer: U.S. climate center -- The El Niño climate phenomenon is almost certain to last through the Northern Hemisphere summer, the U.S. weather forecaster said, raising the chance of heavy rain in the southern United States as well as South America, and scorching heat in Asia that could devastate crops of thirsty food staples like rice. El Niño also reduces the likelihood of a busy hurricane season, which lasts from June to November and can disrupt energy operations in the Gulf of Mexico. In its monthly report released on Thursday, the National Weather Service's Climate Prediction Center (CPC) said El Niño, a phenomenon which warms sea-surface temperatures in the Pacific, had a 90 percent likelihood of continuing through the summer. In April it estimated the odds at 70 percent. El Niño conditions will likely last through the end of the year, the CPC said, pegging the chance at 80 percent. "[El Niño]'s definitely upon us and it should remain so for the next few months," said Don Keeney, a meteorologist with Maryland-based MDA Weather Services. A strong El Nino last appeared in 2009-2010 and resulted in significant spikes in sugar, cocoa and wheat prices.
Super El Nino Likely as Huge Warm Water Wave Hits West Coast, Extreme Marine Die Off Developing - In early March, the strongest wave of tropical convection ever measured (known as the Madden Julian Oscillation) by modern meteorology moved into the western Pacific from Indonesian waters bringing an outbreak of 3 tropical cyclones, including deadly category 5 Pam which ravaged the south Pacific islands of Vanuatu. This extreme outburst of tropical storms and organized thunderstorms pulled strong westerly winds across the equator, unleashing a huge surge of warm water below the ocean surface. Normally, trade winds blow warm water across the Pacific from the Americas to Australia and Indonesia, pushing up sea level in the west Pacific. When the trade winds suddenly reversed to strong westerlies, it was as if a dam burst, but on the scale of the earth's largest ocean, the Pacific. The front edge of that massive equatorial wave, called a Kelvin wave, is now coming ashore on the Americas. Last year the largest Kelvin wave ever seen in the Pacific ocean developed in February. After it came ashore and the surge of warm water moved up the Pacific coast, the upwelling of nutrient rich cold water dramatically slowed, and marine life began starving up and down the coast of north America. As the warm water moved north from the equator it merged with an enormous mass of warm stagnant water dubbed "the blob" which had built up in the central north Pacific ocean under the mound of high barometric pressure known as the Pacific high. Because the Pacific high had expanded north of its normal position, possibly because of climate change, warm, stagnant low nutrient water covered a large percentage of the surface of the north Pacific ocean. That stagnant water came ashore on the coast of the Pacific northwest and Alaska as the surge of warm water from the Kelvin wave moved up the California coast. The warm stagnant water lacked nutrients to support the growth of krill and copepods which are at the bottom of the food chain. Species that fed on krill and copepods had little to eat. Juvenile birds were the first to be affected by the lack of food. The west coast marine die off is already a crisis but it's likely to get much worse this summer and fall as the surge of warm water moves up the coast from the huge Kelvin wave now coming ashore.
Rising sea levels threaten Florida cities, but state has few plans – Saltwater intrusion forcing cities to abandon water wells: – America’s oldest city is slowly drowning. St. Augustine’s centuries-old Spanish fortress is feet from the encroaching Atlantic, whose waters already flood the city’s narrow streets about 10 times a year — a problem worsening as sea levels rise. The city relies on tourism, but visitors might someday have to wear waders at high tide. “If you want to benefit from the fact we’ve been here for 450 years, you have the responsibility to look forward to the next 450,” “Is St. Augustine even going to be here?” St. Augustine is one of many chronically flooded communities along Florida’s coast, and officials in these diverse places share a concern: They’re afraid their buildings and economies will be further inundated by rising seas. The effects are a daily reality in much of Florida. Drinking water wells are fouled by sea water. Higher tides and storm surges make for more frequent road flooding from Jacksonville to Key West, and they’re overburdening flood-control systems. But the state has yet to offer a clear plan or coordination to address what local officials across Florida’s coast consider a slow-moving emergency. Republican Governor Rick Scott is skeptical of man-made climate change and has put aside the task of preparing for sea level rise, an Associated Press review of thousands of e-mails and documents pertaining to the state’s preparations for rising seas found. Despite warnings from water experts and climate scientists, skepticism about sea level projections and climate change science has hampered planning efforts at all levels of government, the records showed. Florida’s environmental agencies under Scott have been downsized, making them less effective at coordinating planning, documents showed.
Sea Level Rise Is Happening Faster Than Anyone Thought - Global sea level rise isn’t just happening — it’s happening much faster than previously thought, according to new research from climate scientists at the University of Tasmania, in Australia. The study, published Monday in Nature Climate Change, found that sea level rise has been speeding up over the past two decades compared to the rest of the 20th century. This contradicts previous satellite data dating back to 1993, which appeared to show sea level rise accelerating in the 1990s, but slowing slightly over the past decade. “That slowing has puzzled scientists because it coincides with an increase in water entering our oceans from Greenland and West Antarctica,” Christopher Watson, the study’s lead author, said in a press statement. To understand the apparent slowdown in sea level rise, researchers at the University of Tasmania looked at other factors that might impact sea level measurement, such as changes in the height of the Earth’s land surface. First, Watson and his colleagues compared data from tide gauges — which measure sea level height relative to a specific set of coordinates — to satellite data, which measures the height of the sea surface using radar. Using the newly recalibrated data, the researchers found that sea level rise between 1993 and 1999 — the earliest segment of satellite data — was overstated. According to satellite data, over that six-year period, global sea level rose 3.2 milimeters (about .12 inches) per year; using Watson’s recalibrated data, sea levels probably rose closer to between 2.6 to 2.9 mm (about .1 to .11 inches) per year. This over-estimation of sea level rise gave the appearance of sea level rise slowing in the previous decade, when it was actually accelerating at a rate of between 0.041 and 0.058 mm (.001 to .002 inches) per year.
Sea Level Rise Is On the Up and Up -- Sea level rise is a game of millimeters a year, but those millimeters add up to a huge amount of water entering the world’s oceans. And the rising tide could eventually swamp cities around the globe. With tide gauges distributed sparsely around the planet, scientists have turned to satellites to provide a global picture of sea level since the early 1990s. New research published on Monday in Nature Climate Change refines those satellite estimates and provides some good and bad news. The good news? Total sea level rise is lower than previous estimates. The bad news? Sea level rise rates are speeding up. Christopher Watson, a geodesist from the University of Tasmania, led the latest round of research that adjusts satellite readings taken from hundreds of miles above the Earth to measure small changes in sea level heights around the globe since the early 1990s. “What’s striking is its (the study’s) consistency with future projections of sea level in the IPCC,” Watson said. “Those estimates state that there could be up to 98 centimeters (39 inches) of sea level rise by 2100. We’re certainly tracking on that upper bound of the IPCC projection and that projection to 2100 has significant impacts.”
Carbon Pollution’s Harm To Sea Life Coming Faster Than Expected - The oceans are now acidifying faster than they have been over the last 300 million years, a time period in which there were four major extinctions driven by natural bursts of carbon. In fact, humans are acidifying the oceans 10 times faster today than 55 million years ago when a mass extinction of marine species occurred. Recent research finds that the threat to marine life posed by human-caused carbon pollution is coming faster than expected. And that’s a problem because as 70 Academies of Science warned in a 2009 joint statement on acidification: “Marine food supplies are likely to be reduced with significant implications for food production and security in regions dependent on fish protein, and human health and wellbeing.” Why does carbon pollution threaten marine life? Significantly, as carbon dioxide is absorbed in water it causes chemical reactions that reduce “saturation states of biologically important calcium carbonate [CaCO3] minerals,” which “are the building blocks for the skeletons and shells of many marine organisms,” as NOAA explains. In the parts of the ocean teeming with life, the seawater has an overabundance (supersaturation) of these calcium carbonate minerals used by so-called “calcifying organisms,” which include corals and algae and mollusks and some plankton. As the ocean absorbs more carbon dioxide, more and more places are becoming undersaturated with these minerals, thereby threatening calcifying organisms. Besides a decline in calcification, the World Meteorological Organization explained in 2014, “Other impacts of acidification on marine biota include reduced survival, development and growth rates, as well as changes in physiological functions and reduced biodiversity.”
What's going on in the North Atlantic? -- Stefan Rahmstorf - The North Atlantic between Newfoundland and Ireland is practically the only region of the world that has defied global warming and even cooled. Last winter there even was the coldest on record – while globally it was the hottest on record. Our recent study (Rahmstorf et al., 2015) attributes this to a weakening of the Gulf Stream System, which is apparently unique in the last thousand years. The whole world is warming. The whole world? No! A region in the subpolar Atlantic has cooled over the past century – unique in the world for an area with reasonable data coverage (Fig. 1). So what’s so special about this region between Newfoundland and Ireland? It happens to be just that area for which climate models predict a cooling when the Gulf Stream System weakens (experts speak of the Atlantic meridional overturning circulation or AMOC, as part of the global thermohaline circulation). That this might happen as a result of global warming is discussed in the scientific community since the 1980s – since Wally Broecker’s classical Nature article “Unpleasant surprises in the greenhouse?” Meanwhile evidence is mounting that the long-feared circulation decline is already well underway. Climate models have long predicted such a slowdown – both the current 5th and the previous 4th IPCC report call a slowdown in this century “very likely,” which means at least 90% probability. When emissions continue unabated (RCP8.5 scenario), the IPCC expects 12% to 54% decline by 2100 (see also the current probabilistic projections of Schleussner et al., 2014). But the actual past evolution of the flow is difficult to reconstruct owing to the scarcity of direct measurements. Therefore, in our study we use data on sea surface temperatures in order to infer the strength of the flow: we use the temperature difference between the region most strongly influenced by the AMOC and the rest of the Northern Hemisphere.
Ice loss in west Antarctica is speeding up -- As I’ve previously noted, one of the most challenging problems in climate science deals with how to measure the Earth’s system. In some parts of the planet, the measurements are particularly daunting because of the ruggedness of the terrain and the hostility of the environment. This brings us to a new study just published on Antarctic ice loss by Christopher Harig and Frederik Simons of Princeton. They work in the Princeton Polar Ice program. This study used satellite measurements to determine the rate of mass loss from this large ice sheet. The ice sheet has two parts, a stable and large eastern part and a smaller and less stable western portion. The impact of climate change on these portions is different. The western part is losing mass at an increasing rate over the past years. In the east, however, the information is less clear. Increased precipitation (snowfall) is adding to the ice there, even while portions of the ice are warming. The satellite method that these authors used actually measures the gravitational pull of the ice on two orbiting satellites. The huge ice sheet has such a large mass that it attracts objects toward it. As the ice melts and flows into the oceans, the attraction decreases – it is this change that is measured. They find that the western part of Antarctica is losing mass at 121 billion tons (gigatons) a year. This rate has increased recently. In particular, in one region (the Amundsen Sea coast, the ice loss has doubled in the past six years). In the east, there is a small mass gain (approximately 30 gigatons a year). This mass gain partially offsets what is happening in the west but there is still a large loss of water to the sea each year.
Antarctic Larsen-C ice shelf at risk of collapse, study warns -- In the past 20 years, warming temperatures have caused two ice shelves in Antarctica to collapse into the ocean. New research points to a third shelf, more than twice the size of Wales, which has thinned so much that it could now also face collapse. The loss of the shelf would allow glaciers to flow more quickly into the ocean, pushing sea levels beyond current projections for this century, the researchers say. An ice shelf forms when a glacier on land reaches the coast and flows into the ocean. If the ocean is cold enough, the ice doesn't melt. Instead, it forms a permanently floating sheet of ice. The Larsen ice shelves sit at the tip of the Antarctic Peninsula, the northernmost part of the mainland. Originally there were four. But Larsen-A collapsed in 1995, followed by Larsen-B in 2002. Larsen-C, the largest section, and Larsen-D are all that remain. Click to view the disintegration of Larsen B: The new study, published in The Cryosphere, says that Larsen-C is thinning rapidly. Using satellite data, the researchers show that from 1998 and 2012, the ice shelf has thinned by four metres, and is now sitting one metre lower in the water. The British Antarctic Survey (BAS), whose scientists led the research, produced a short video to explain their findings:
This Antarctic ice shelf could collapse by 2020, NASA says -- It has been a really bad week for the ice shelves of the quickly warming Antarctic peninsula, the part of the vast frozen continent that extends northward toward South America. Earlier this week, we learned that the gigantic marine-based Larsen C ice shelf, which is almost as big as Scotland, has several worrisome vulnerabilities — including a growing rift across it. Scientists from the British Antarctic Survey and several other research centers say this could pose an “imminent risk” to its stability. And now, NASA scientists are giving an even worse verdict for the remnants of the nearby Larsen B ice shelf, much of which already disintegrated back in 2002. Back then, the shelf lost a region larger than Rhode Island, but there are still 618 square miles left of it — for now. However, in a new study in Earth and Planetary Science Letters, researchers with NASA’s Jet Propulsion Laboratory and the University of California at Irvine say that this remnant now faces its “approaching demise.” In a news release, NASA adds that the ice shelf “is likely to disintegrate completely before the end of the decade.” If these two research teams are right, then the coming years could see major ice calving events off of the Antarctic peninsula — especially for Larsen B. “What might happen is that for a few years, we will have the detachment of big icebergs from this remaining ice shelf, and then at one point, one very very warm summer, when you have lots of melting of the surface, the whole thing will just give way, and will shatter into thousands of smaller icebergs,” says the Jet Propulsion Laboratory’s Ala Khazendar, lead author of the new study.
Why A Major Free Trade Deal Could Have Huge Consequences For The Climate - A wide-reaching trade agreement between the United States and several Asian nations could have catastrophic repercussions for climate change, including giving corporations the power to sue governments that try to limit polluting industries, environmental groups say. In order to avoid dangerous climate change, scientists estimate that 80 percent of the world’s fossil fuels need to remain in the ground. But coal, natural gas, and oil left in the ground means profits left on the table for fossil fuel companies. And under the proposed Trans-Pacific Partnership (TPP), corporations will likely be able to sue governments that interfere with their business — even if it’s by enacting carbon reduction goals and passing environmental legislation. “Creating a corporate bill of rights to protect investors is incredibly undermining to our ability to protect the environment,” Ben Schreiber, the climate and energy program director for Friends of the Earth, told ThinkProgress. Previous trade deals have, in fact, led to lawsuits over fossil fuels. An American mining company, Lone Pine Resources, sued the Canadian province of Quebec in 2013 for passing a ban on fracking. The company says the ban cost them $250 million and that under the North American Free Trade Agreement (NAFTA), Quebec is liable for the lost revenue. That lawsuit is ongoing. In another lawsuit, Chevron alleged that Ecuadorian activists had defrauded the company, after it was ordered to pay $18.2 billion in damages for environmental contamination. The administration has been criticized for a lack of transparency — specific details of the TPP remain largely unknown, even to members of Congress, although WikiLeaks has published some chapters, including one dealing with environmental regulations.
2C warming goal is a 'defence line', governments told: The international goal to limit global warming to 2C should be “stringently defended”, UN climate negotiators will be told next month. Even this level of temperature rise would put the world’s poor at “very high risk” of climate impacts and “less warming would be preferable”. These were some of the key messages from two years of talks between more than 70 country representatives and scientists, published by the UN this week. Countries agreed on the 2C threshold in 2009, but the necessary policies to cut greenhouse gas emissions have proved elusive. Few expect that a global climate deal due to be struck in Paris this December will set the world on a 2C path, beyond which scientists say floods, droughts and rising sea levels will become more common. Instead, diplomats talk of keeping 2C “within reach” and creating an enduring framework to ratchet up ambition in future. But the UN report, based on evidence from several leading figures from the Intergovernmental Panel on Climate Change, cautions against complacency. It says: “The ‘guardrail’ concept, in which up to 2C of warming is considered safe, is inadequate and would therefore be better seen as an upper limit, a defence line that needs to be stringently defended, while less warming would be preferable.”
Little Chance to Restrain Global Warming to 2 Degrees, Critic Argues - Scientific American: C’mon, docs. Give it to us straight. That’s the message one researcher has for the planet’s physicians, the climate scientists who are diagnosing whether a new international agreement can keep us from busting the boundary of dangerous global warming. Oliver Geden, a senior research fellow at the German Institute for International and Security Affairs in Berlin, makes the case that the accord expected to be signed in Paris in December won’t even put the world within reach of keeping global temperatures from rising more than 2 degrees Celsius above preindustrial levels. He contends that scientists and economists must level with the public and stop spreading what he calls “false optimism” that the target can ever be reached. “Climate scientists and economists who counsel policy-makers are being pressured to extend their models and options for delivering mitigation later. This has introduced dubious concepts, such as repaying ‘carbon debt’ through ‘negative emissions’ to offset delayed mitigation—in theory,” Geden wrote in a commentary published yesterday in the journal Nature. “Scientific advisers must resist pressures that undermine the integrity of climate science. Instead of spreading false optimism, they must stand firm and defend their intellectual independence, findings and recommendations—no matter how politically unpalatable,” he argued.
Scientists: Earth Endangered by New Strain of Fact-Resistant Humans - Scientists have discovered a powerful new strain of fact-resistant humans who are threatening the ability of Earth to sustain life, a sobering new study reports. The research, conducted by the University of Minnesota, identifies a virulent strain of humans who are virtually immune to any form of verifiable knowledge, leaving scientists at a loss as to how to combat them. “These humans appear to have all the faculties necessary to receive and process information,” Davis Logsdon, one of the scientists who contributed to the study, said. “And yet, somehow, they have developed defenses that, for all intents and purposes, have rendered those faculties totally inactive.” More worryingly, Logsdon said, “As facts have multiplied, their defenses against those facts have only grown more powerful.” While scientists have no clear understanding of the mechanisms that prevent the fact-resistant humans from absorbing data, they theorize that the strain may have developed the ability to intercept and discard information en route from the auditory nerve to the brain. “The normal functions of human consciousness have been completely nullified,” Logsdon said. While reaffirming the gloomy assessments of the study, Logsdon held out hope that the threat of fact-resistant humans could be mitigated in the future. “Our research is very preliminary, but it’s possible that they will become more receptive to facts once they are in an environment without food, water, or oxygen,” he said.
Pope’s top adviser blasts US climate skeptics - Pope Francis’ closest adviser castigated conservative climate change skeptics in the United States Tuesday, blaming capitalism for their views. >Speaking with journalists, Cardinal Oscar Rodríguez Maradiaga criticized certain “movements” in the United States that have preemptively come out in opposition to Francis’s planned encyclical on climate change. “The ideology surrounding environmental issues is too tied to a capitalism that doesn’t want to stop ruining the environment because they don’t want to give up their profits,” Rodríguez said, according to the Boston Globe's Crux blog. Rodríguez’s comments came at the beginning of the annual meeting of Caritas Internationalis, an association of Catholic charitable groups.
Geoengineering: Forced Upon Us? - We may hate the idea of countering amazing amounts of pollution with yet more pollution of a different type. But the option is simply too cheap to ignore. It’s not like anyone would literally mimic Mount Pinatubo by pumping 20 million tons of sulfur dioxide into the stratosphere. At the very least, given current technology and knowledge, the sulfur would likely be delivered in the form of sulfuric acid vapor. Sooner rather than later, we may be looking at particles specifically engineered to reflect as much solar radiation back into space as possible, maximizing the leverage. It may only take a fleet of a few dozen planes flying 24/7 to deliver the desired amount. Some have gone as far as to calculate how many Gulfstream G650 jets it would take to haul the necessary materials. But such specifics are indeed too specific. What matters is that the total costs would apparently be low compared to both the damage carbon dioxide causes and the cost of avoiding that damage by reducing carbon emissions. Estimates are all over the place, but most put the direct engineering costs of getting temperatures back down to pre-industrial levels on the order of $1-to-$10 billion a year. Now, $1-to-$10 billion is not nothing, but it’s well within the reach of many countries and maybe even the odd billionaire. If a ton of carbon dioxide emitted today generates $40 in damage, we are talking fractions of a penny for the sulfur to offset it. ... Geoengineering is too cheap to dismiss as a fringe strategy developed by sinister scientists looking for attention and grant money, as some pundits would have it. If anything, it’s the most experienced climate scientists who take the issue most seriously. And not because they want to. ...Pick your favorite analogy. It’s like chemotherapy or a tracheostomy for the planet: a last-ditch effort to do what prevention failed to accomplish. ... As always, it’s a matter of trade-offs. Climate change itself will have plenty of unsavory side effects. The question, then, is not whether geoengineering alone could wreak havoc. (It could.) The question is whether climate change plus geoengineering is better or worse than unmitigated climate change.
In Ohio, energy-saving upgrades hampered by 'freeze' - Ohio continues to have a huge untapped potential for combined heat and power, or CHP — a clean energy technology that could save customers money and improve the state’s electric security while capitalizing on the current shale gas boom. However, a “freeze” in the state’s clean energy standards and other factors still slow down the payback period for companies and cities investing in CHP, business leaders reported at an Energy Ohio Network program in Columbus last week. Moreover, neither state senators Troy Balderson (R-Zanesville) nor William Seitz (R-Cincinnati), who spoke at the event, offered assurances that policy incentives to help the industry grow would be back in place soon. Energy Ohio Network’s mission is to leverage shale natural gas resources, distributed energy opportunities and advanced energy technologies “so that Ohio’s business, non-profits, and citizens fully realize the economic and environmental benefits that these new 21st century opportunities create.” Among those technologies is CHP—the simultaneous or sequential use of power and heat from one fuel source. Many facilities use natural gas in industrial processes that release excess heat into the air. “Instead of letting those thermals go away, we recover them,” explained Kevin Abke of Ohio CAT’s Power Systems Division in Perrysburg, Ohio. That heat energy can power electric generators. It can also produce hot water and, through condensing processes, chilled water.
Virginia Is for Dirty-Energy Lovers - If you live in Virginia and would like to shrink your carbon footprint, here's what passes for good news: We're now officially free to ban fracking. For two years, Old Dominion communities weren't at liberty to prevent that kind of oil and gas drilling. After the cities of Staunton, Lynchburg, and several other local governments expressed reservations over fracking or tried to prevent it, former Attorney General Ken Cuccinelli said they lacked the authority to block Big Fossil. In early May, Virginia Attorney General Mark Herring overrode his predecessor's position and asserted that these local policies adhere to state law. Either way, Richmond-based Dominion Resources, which wields near-monopoly power over Virginia's electric grid, wants to boost demand for this environmentally hazardous drilling. It's partnering with other companies on a $5 billion pipeline that will funnel gas fracked in West Virginia, Ohio, and Pennsylvania over a 550-mile route to Virginia and North Carolina. Dominion's dirty-energy ambitions for its home state don't stop there. The company also intends to drop $10 billion on a third nuclear reactor at a site within 50 miles of Richmond, Charlottesville, and Fredericksburg. The firm Clean Edge ranks big utilities according to how much power they draw from solar, wind, and other renewable options and their energy efficiency efforts. Dominion made the bottom of the list.
French Nuclear Model Falters - — For decades, France has been a living laboratory for atomic energy, getting nearly three-quarters of its electricity from nuclear power — a higher proportion by far than in any other country.And France’s nuclear companies have long been seen as leaders in building and safely operating uranium-fueled reactors around the world — including in the United States — and championed by Paris as star exporters and ambassadors of French technological prowess. But in the last few years, the French dynamo has started to stall. New plants that were meant to showcase the industry’s most advanced technology are years behind schedule and billions of euros over budget. Worse, recently discovered problems at one site have raised new doubts about when, or even if, they will be completed.This is not France’s problem alone, but a challenge to the entire energy-consuming world. As worries mount about the dangers fossil fuels pose to the global climate, many countries still see atomic power as a path to clean energy, despite the 2011 Fukushima disaster in Japan. But if the French can no longer demonstrate that modern nuclear power plants can be built on time and on budget, that could add to the stigma that has made many countries think twice, over concerns about safety and radioactive waste. Germany and Switzerland, for example, have dropped nuclear power as an energy option.
US nuclear plant explosion: transformer failure caused fire but no injuries - A transformer failed at the Indian Point nuclear power plant in suburban New York, causing a fire that forced an automatic shutdown of a reactor. The fire was quickly extinguished and the reactor was deemed safe and stable, said a spokesman for owner Entergy Corp. The transformer at Indian Point 3 takes energy created by the plant and changes the voltage for the grid supplying power to the state. The blaze, which sent black smoke billowing into the sky Saturday, was extinguished by a sprinkler system and on-site personnel, Entergy spokesman Jerry Nappi said. Westchester County police and fire were on site as a precaution. It was not immediately clear what caused the failure, or whether the transformer would be repaired or replaced. Nappi said there were no health or safety risks. It’s unclear how long the 1,000-megawatt reactor will be down. Entergy is investigating the failure. The plant’s adjacent Unit 2 reactor was not affected. The Indian Point Energy Center in Buchanan, 35 miles up the Hudson River from midtown Manhattan, supplies electricity for millions of homes, businesses and public facilities in New York City and Westchester County. In accordance with federal regulations, the U.S. Nuclear Regulatory Commission, state, county and local officials were notified of the event, considered the lowest of four emergency classifications for US nuclear plants.
Fire at nuclear power plant 35 miles from New York City - A transformer exploded at the Indian Point nuclear power plant in suburban New York - only 35 miles away from midtown Manhattan - on Saturday, sending black smoke billowing into the sky.The blaze, which sparked an oil leakage, forced the automatic shutdown of the facility's Unit 3 reactor, which sits near the Hudson River and supplies five per cent of the power to the state.It was initially extinguished by a sprinkler system and on-site personnel, officials said. It then started up again, but has since been put out. Police and firefighters were at the site as a 'precaution'.The transformer at Unit 3 takes energy created by the plant and changes the voltage for the grid supplying power to New York. It was not immediately clear what caused it to fail at around 6pm.It is also unclear whether the transformer will be repaired or replaced. The adjacent Unit 2 reactor was not affected by the failure, and there were no injuries, Entergy spokesman Jerry Nappi said.However, New York Governor Andrew Cuomo, who was briefed on the transformer's failure at the site on Saturday, said the fire had caused oil to leak, which could possibly spill into the river.
Transformer Explosion At The Indian Point Nuclear Facility Near New York Is 'Contained' -- The words "explosion", "New York", "black smoke", and "nuclear" strike fear into the heart of most people but according to Entergy - who runs Indian Point, "the nuclear facility has been safely shutdown following a transformer failure." Reports of a loud blast at the nuclear facility just 38 miles north of New York, with dense black smoke rising from Unit 3 are no concern and represent "no danger to public health and safety." The plant, which dates back to 1962 (although the currently used reactors were installed later in the 70s) had just been brought back online on Friday, after being shut down for a steam leak repair.
Oil leaked into Hudson River after fire at nuclear reactor near NYC - Oil leaked into the Hudson River on Sunday after a transformer fire and explosion a day earlier at the Indian Point nuclear plant north of New York City. Governor Andrew Cuomo said he was concerned about environmental damage. Cuomo visited the plant for a briefing on Sunday. The governor, who in the past has called for the plant to be shut down because of its proximity to densely populated New York City, also visited the plant on Saturday. When the transformer exploded, it released oil into a holding tank, which then overflowed, sending oil onto the ground and into the river, Cuomo told reporters on Sunday after he was briefed by emergency and plant officials. He said crews were working to contain and clean up the oil spill but it was not clear yet how much oil had been released. "If you are on site, you see an oil sheen all over the area where the transformer went on fire, and it was a significant area that was covered by oil, foam, and water," Cuomo said. The transformer explosion and fire at the nuclear power reactor 40 miles (65 km) north of New York City was quickly put out. The fire triggered the closure of the plant's Unit 3 reactor, while the other Unit 2 reactor continued to operate. Entergy Corp, which runs the facility and is one of the largest US nuclear power operators, said the plant was stable and there was no danger to the public or to employees.
NY Governor Probes Nuclear Plant 'Incident' As Oil Spills Into Hudson River ---Having explained to the general public that there was nothing to be concerned about, when an exploding transformer shut down at least one unit of the Indian River nuclear power plant, noting "no danger to public safety," it appears the situation is not as 'contained' as officials hoped. As Sputnik News reports, thousands of gallons of oil that leaked into the Hudson River after the explosion has formed a gigantic oil sheen on the waterway. NY Governor Andrew Cuomo has demanded a probe into the incident, adding that Entergy and contractors will clean up the spill. As Sputnik News reports, The oil made its way into the river following an explosion, fire, and leak that occurred Saturday at the Indian Point nuclear facility in Buchanan, about 40 miles north of Midtown Manhattan. According to the US Nuclear Regulatory Commission (NRC), oil leaked into the facility's discharge drains during the fire, then into the river. However, "there is no doubt that oil was discharged into the Hudson River," New York Governor Andrew Cuomo said at Indian Point on Sunday. "We have booms in the water now around the discharged pipe to collect any oil that may be in the river."
Did We Almost Lose New York? -- For the third time in a decade, a major fire/explosion has ripped apart a transformer at the Indian Point reactor complex. News reports have taken great care to emphasize that the accident happened in the “non nuclear” segment of the plant. Ironically, the disaster spewed more than 15,000 gallons of oil into the Hudson River, infecting it with a toxic sheen that carried downstream for miles. Entergy, the nuke’s owner, denies there were PCBs in this transformer. It also denies numerous studies showing serious radioactive health impacts on people throughout the region. But PCBs were definitely spread by the last IP transformer fire. They re-poisoned a precious liquid lifeline where activists have spent decades dealing with PCBs previously dumped in by General Electric, which designed the reactors at Fukushima.Meanwhile, as always, the nuclear industry hit the automatic play button to assure us all that there was “no danger” to the public and “no harmful release” of radiation. At an integrated system like a reactor complex, are there really any significant components whose impacts are totally removed from the ability to touch off a nuclear disaster? A “non nuclear” earthquake, 120 kilometers away, caused Fukushima One to melt, and then explode. At Indian Point, “non nuclear” gas pipelines flow dangerously close to highly vulnerable reactors. In an utterly insane proposal that almost defies description, corporate powers want to run another gas pipeline more than 40 inches in diameter within a scant few yards of the reactor epicenters. An explosion that could obliterate much of the site would of course be “non nuclear” in origin. But the consequences could be sufficiently radioactive to condemn millions of humans to horrifying health consequences and render the entire region a permanent wasteland.
Duke Energy Pleads Guilty To Nine Environmental Crimes, Agrees To Pay $102 Million - Duke Energy plead guilty to nine federal misdemeanors related to illegally discharging pollution from coal ash ponds in North Carolina on Thursday afternoon, and agreed to pay $102 million in fines and restitution. Federal prosecutors charged Duke with the nine violations of the Clean Water Act in February, asserting that the company had been illegally dumping coal ash from five of its North Carolina power plants since at least 2010. Duke, the nation’s largest electricity company, had already worked out a plea bargain with the federal government at the time of the charges, and Thursday’s proceeding finalized the deal. It also stood as a reminder of the damage caused by the company’s environmental negligence. As the Associated Press reported, Judge Malcolm Howard went through each of the misdemeanors individually, asking Julia Janson, the company’s chief legal officer, if the company had engaged in each action. After responding “yes” to each instance she then replied “softly” that Duke was indeed pleading guilty to each count. “In the court hearing, prosecutors gave multiple examples where Duke employees knew or were warned that they were discharging pollution into the state’s waterways and they were slow to do anything or took no action at all,” the Associated Press reported.
Proposed Rule Would Keep Allowing Coal Companies To Cheat Taxpayers Out Of Billions, Critics Say - A seemingly low-profile proposal from a little-known natural resources agency in the Department of the Interior (DOI) has attracted a record-breaking 210,000 public comments from taxpayers, who argue that they are not receiving a fair share of revenues from the mining of coal on U.S. public lands. The public outcry came in response to a proposed rule from DOI’s Office of Natural Resources Revenue that aims to close a regulatory loophole that allows coal companies to avoid paying royalties owed to taxpayers. Critics argue that the proposed rule does not go far enough to guarantee that western states and U.S. taxpayers are receiving a fair value for the coal mined on America’s public lands, due to additional subsidies given to coal companies under the rule. “Montana has lost over $30 million in coal royalties that should have been revenue to the state.” In January, a report from the Center for American Progress uncovered evidence that coal companies are dodging royalty payments owed to taxpayers by selling coal to their own subsidiary companies and then paying royalties on artificially low prices. Reviews of the Department of the Interior’s coal program have also found that coal companies are taking advantage of up to $1 billion a year in royalty rate reductions and subsidies for washing and transporting coal. According to public opinion research released last week, most Americans oppose providing subsidies to coal companies that mine on public lands. The poll found that, by an almost two-to-one margin, respondents said they would prefer to see the subsidies ended. The research also found that 71 percent of Americans support reforms that would require coal companies to pay a fee to compensate for environmental damage; 69 percent want coal companies to pay royalties on the true value of coal at the price it is sold to a power plant or exporter; and 62 percent want reforms that would increase required royalties overall.
Government approved illegal coal extensions, Jackson rules - Colorado would have been wise to administer more thorough environmental evaluations before authorizing extensions for two coal mines in 2007. Environmental advocacy group WildEarth Guardians announced victory today in a lawsuit challenging extensions to the Colowyo and Trapper coal mines, which Judge R. Brooke Jackson ruled were illegally approved. “This rule is a major victory for the American public, for our climate, and for our clean air,” WildEarth’s Climate and Energy Program Director Jeremy Nichols said in the announcement. “Our federal government can no longer turn a blind eye to the public and the need to safeguard our health and environment.” Coal from Colowyo and Trapper mines power the state’s second-largest power plant. According to the release, the plant’s three smokestacks belch out 12,000 tons of smog each year, which is equivalent to emissions from more than 1 million cars. Judge Jackson criticized the government for its secrecy in extension approvals, neglect of the environmental impacts from coal power and using “outdated” methods of environmental analysis. Tri-State spokesman Lee Boughney told The Denver Post that the company was “disappointed” by Judge Jackson’s verdict. He said the company’s mines account for 220 jobs in Colorado and contribute $200 million to the local economy. In lieu of the verdict, Judge Jackson implored the Office of Surface Mining to “take a hard look at the direct and indirect Environmental effects of the Colowyo mining revision plan.”
China is on track for the biggest reduction in coal use ever recorded – China is cutting down on its coal habit. In the first four months of 2015, the country consumed almost 8% less coal than in the same period a year earlier, according to a report by Greenpeace/Energydesk China.This means China’s carbon dioxide (CO2) emissions fell by around 5% in the first four months of the year, according to the report. That’s a lot—roughly equal to the volume of CO2 emissions spewed by the entire UK during that same period, as Greenpeace/Energydesk China notes. If the trend continues, China will close out 2015 with the biggest reduction in both coal use and CO2 every recorded by a single country, the environmental activist group says. Already, the People’s Republic’s sputtering coal consumption, which began last year, seems to have put a big dent in global CO2 emissions. Those generated from energy use stopped growing in 2014, according to the International Energy Agency. The only other times this happened was in the early 1980s, 1992, and 2009—when the global economy has floundered, in other words. For a drop like this to come in the absence of a widespread economic slump is unprecedented. What’s behind the drop? Part of it is, of course, the Chinese economy’s own sharp slowdown. Industrial production rose 5.9% in April, the smallest increase since the global financial crisis set in during late 2008. Coal production fell 7.4%, even as electricity output rose slightly. Share Tap image to zoomA related factor is that China still produces way more coal than it needs, thanks to the breakneck pace of the industry’s expansion in the wake of the financial crisis, when the government made borrowing unusually cheap. Prices have fallen on the order of 20%.
Ohio waterless fracking well's output lagging - The waterless fracking well tested in eastern Ohio has produced disappointing results, dealing a blow to the innovative technology that could help use less water in oil and gas operations and open up Ohio’s oil window. The $22 million test well, drilled by EV Energy Partners and eight other companies in Tuscarawas County, has produced for 90 days. The well, called Nettles, produced half the amount of oil as a nearby well fracked using a lot of water, EV Chairman John Walker told analysts Monday in an earnings call. "We clearly have work left to do in the volatile oil window to determine its economic potential," he said, "but are separately making progress working toward a drilling joint venture to provide the capital for drilling a portion of our operated Utica wet gas window acreage." A typical Utica well is in the $6.5 million to $8 million range, said director Ken Mariani. “So the $22 million obviously was a significant incremental cost over a more traditional completion,” he said. However, because the well flows back hydrocarbons, not water, that can be resold, the actual cost might be closer to $15 million, he said.
Fracking's impact on air quality in Carroll County? More studies needed - Two researchers say that more studies are needed to determine what impact natural gas drilling has had on air quality in Carroll County. An initial study conducted in 2014 found that levels of polycyclic aromatic hydrocarbons (PAH) around active wells in Carroll County were higher than those sampled in Chicago, urban Egypt and near a petroleum refinery in Belgium. PAHs are organic compounds, some of which are toxic. Erin Haynes, of the Department of Environmental Health at the University of Cincinnati, and Diana Rohlman, of the College of Public Health and Human Services at Oregon State University, gave a presentation on the study to members of Carroll Concerned Citizens on Thursday. Rohlman described it as preliminary. “We just wanted to get a flavor of what’s going on,” she said. Before researchers from the University of Cincinnati and Oregon State University conducted the study, no one had published a paper on hydraulic fracturing, or fracking, Haynes said. The study was conducted in two phases. The phase one results show that PAHs were highest in the air closes to active wells. PAH levels decreased when the samples were further away from the wells. In phase two, conducted in May 2014, six samplers each were placed around five wells in Carroll County at varying distances. In addition, 25 volunteers living in the county wore passive personal sampler wristbands to monitor what chemicals they were exposed to during an average day. The volunteers also filled out health surveys. The results from phase two have yet to be analyzed. Haynes said she hoped to have data from the wristbands by early this fall.
Ohio study tracks air pollution from fracking - Summit County Citizens Voice -- Careful air sampling near active natural gas wells in Carroll County, Ohio showed the widespread presence of toxic air pollution at higher levels than the Environmental Protection Agency considers safe for lifetime exposure, according to scientists from Oregon State University and the University of Cincinnati. The study reinforces the need for more extensive air quality monitoring in fracking zones around the country, where exposure to the poisonous emissions are likely to lead to increased risk of cancer and respiratory ailments. “Air pollution from fracking operations may pose an under-recognized health hazard to people living near them,” said the study’s coauthor Kim Anderson, an environmental chemist with OSU’s College of Agricultural Sciences. Anderson and her colleagues collected air samples during a three-week period last February in a highly fracked area, with more than one active well site per square mile. The study was spurred by local residents who wanted to know more about possible health risks.The air samplers were placed on the properties of 23 volunteers living or working at sites ranging from right next to a gas well to a little more than three miles away. The samples were sent to Anderson’s lab at OSU, where the analysis showed high levels of PAHs across the study area. Levels were highest closest to the wells and decreased by about 30 percent with distance. Even the lowest levels — detected on sites more than a mile away from a well — were higher than previous researchers had found in downtown Chicago and near a Belgian oil refinery. They were about 10 times higher than in a rural Michigan area with no natural gas wells.
Fracking could increase risk of cancer, new study finds - Living near to active fracking sites could increase the risk of cancer as the process harmful chemicals into the air, a new study has found. Researchers from Oregon State University (OSU) and the University of Cincinnati found that hydraulic fracturing, commonly known as fracking, releases polycyclic aromatic hydrocarbons (PAHs), which are linked to cancers and respiratory diseases. Co-author Kim Anderson, an environmental chemist at OSU, said: "Air pollution from fracking operations may pose an under-recognised health hazard to people living near them." The study was published in Environmental Science & Technology. The team took air samples from sites near active natural gas wells in Carroll County, Ohio. The area is rife with fracking sites, having more than one active well per square mile. Aluminium boxes containing polyethylene ribbons, which absorb pollutants in a similar manner to living cells, were used to measure PAH levels in the air. Even the lowest PAH levels detected - those collected from air samples more than a mile away from a well - were 10 times higher than sites with no natural gas wells.The team calculated that the cancer risk posed to a person living or working close to the well and constantly exposed to the pollutant exceeded the US Environmental Protection Agency's safe risk levels.
Oil and gas companies exploit our state - Columbus Dispatch - The Thursday So to Speak column “ Deference to fracking demands shake-up,” by Dispatch Columnist Joe Blundo, set me off again. I think the following items need to be researched and exposed to the light of day:
- • Fracking tax increase: Thanks to some Republicans in the House and Senate, the oil and gas companies have been taking advantage of Ohio residents. These folks take campaign contributions and then do everything in their power to protect the companies. These politicians have a fiduciary responsibility to all Ohioans.
- • Disposal wells: The geologic structure of Ohio, I am told, is conducive to disposal wells where the geologic structures of Pennsylvania and West Virginia are not, thus we take their brine in addition to our own. Apparently the Supreme Court has ruled that Ohio must take others’ trash, citing “restraint of trade” if it doesn’t.
- • Old wells: The state (you and me) is paying to cap hundreds of wells that have been abandoned when businesses walk away.
- • New York trash: Ohio takes, and has taken for years, trash from New York City for disposal in our landfills. In Columbus, we wisely are paying to use a recycling system to limit the amount of trash we put in our landfills. Follow the money on that one, too.
- • Water: Where are the oil and gas companies getting the billions of gallons of fresh water? From Lake Erie? It’s from our groundwater, but are they paying what the market will bear for that Ohio resource, as well?
Ohio fracking regulator ODNR getting new earthquake monitors - The Ohio agency that regulates oil and gas drilling is getting four new seismometers to watch for fracking-related earthquakes. The new earthquake monitors won’t be in eastern Ohio, though, where oil and gas hydraulic fracturing is prevalent and has sparked concerns of seismic activity. Two monitors instead will go to western and northwestern parts of the state, while the locations for the other two are to be determined. The four new seismometers will give the state 23 total. See Also Fracking-earthquake link may impact insurance policies Source of quakes remains elusive in drilling circles “We’re filling in the gaps,” said Ohio Department of Natural Resources spokesman Eric Heis. “We already have a lot in the eastern part.” The agency asked for the devices as part of a $240,000 request the Ohio Controlling Board will hear next week. Two-thirds of that money will go toward the seismometers.
Waterless fracking test well isn't doing so hot - -- While the oil and gas industry was excited about the idea of waterless fracking and the environmental and health benefits that it would bring, it is sad to say the Ohio well testing waterless fracking isn’t exactly that bright light at the end of tunnel. The $22 million test well operated by EV Energy Partners LP, along with eight other companies, in Tuscarawas County, Ohio, has officially been producing for 90 days but didn’t quite meet expectations. Nettles, the test well, produced half the amount of oil that its neighboring well that used water produced. EV Energy Partners LP’s Chairman John Walker shared the information on Monday during an earning calls with analysts. Walker also commented on the amount of work the company needs to do: We clearly have work left to do in the volatile oil window to determine its economic potential … But are separately making progress working toward a drilling joint venture to provide the capital for drilling a portion of our operated Utica wet gas window acreage. EV Energy’s Director Ken Mariani said that the costs of drilling a typical well in the Utica shale formation usually costs $6.5 million to $8 million. As Mariani explained, it is obvious that $22 million on one well is a lot of money. He also explained that even though the well isn’t producing as much because it flows back hydrocarbons, which can be resold, the ending cost of the well could be closer to $15 million.As reported by Columbus Business First, “Waterless fracking isn’t over – Chesapeake Energy Corp. (NYSE:CHK), the biggest oil and gas driller in Ohio, is testing waterless fracking and EV Energy Partners said it’ll continue testing the Nettles well, specifically to evaluate the quality of the shale rock.”
Utica and Marcellus well activity in Ohio -- Activity in the Utica Shale formation and Marcellus Shale formation in Ohio have both seen little change when compared to the last activity report. Yet for one company, selling its Ohio acreage is top priority. Magnum Hunter Resources Corp., one of the more vocal advocates for the Utica Shale formation, shared that it is selling $450 million worth of its land in Ohio. The company is working out a joint venture deal with plans to sell some of its undeveloped and unproved acreage in the Utica shale play. The decision to sell is part of five different actions Magnum Hunter is taking to better its liquidity. After losing $105.9 million during the first three months of this year, the company decided that something needed to be done to boost its liquidity. As of now, Magnum Hunter has 130, 000 leased acres in eastern Ohio’s Utica shale but does not have any drilling rigs or plans to complete any wells. Evans said he is anticipating that there will be more cuts in service costs and improvements in the company’s capital position, and this is one way Magnum Hunter is preparing for that. The following information is provided by the Ohio Department of Natural resources and is through the week of May 2nd. Activity in the Utica Shale formation in Ohio has had a few slight changes when compared to last week’s update. According to this week’s report, 423 wells were permitted, 565 drilled, 861 producing, 13 inactive, 24 in final restoration and 3 abandoned. This brings the total number of wells in the Utica to 1,889. The Marcellus Shale in Ohio has zero change reported when compared to last week’s well report. The area is still sitting at 15 wells permitted, 13 drilled (up 1), 14 producing (down 1) and one well inactive. There are a total of 43 wells in the Ohio Marcellus Shale.
Marcellus permit activity in Pennsylvania - Over the last week, new permitting in the Marcellus Shale formation in Pennsylvania has seen quite an increase. However, permits aren’t the only thing getting attention in the state. Governor Tom Wolf’s proposed severance tax was recently put under the microscope for observation. Associated Petroleum Industries of Pennsylvania’s (API-PA) Executive Director Stephanie Catarino Wissman broke down the new severance tax study, titled “The Economic Impacts of the Proposed Natural Gas Severance Tax in Pennsylvania” in a recent press briefing. The study focused on the possible economic impacts Wolf’s proposed natural gas severance tax would have on unconventional natural gas producers in Commonwealth. It was conducted by Timothy Considine, along with Natural Resources Inc., and was approved by the American Petroleum Institution (API).During her briefing, Wissman explained how the current natural gas impact fee has benefitted the state’s Commonwealth greatly: The U.S. oil and natural gas industry delivers hundreds of millions of dollars to the Commonwealth. The current local impact tax, which is collected from every shale drilling site in the state, has distributed more than $630 million to communities since 2012 – including more than $224 million in just 2014. That’s on top of over $2.1 billion in state and local taxes already generated by our industry. The following information is provided by the Pennsylvania Department of Environmental Protection and covers May 4th through May 10th. New: 32 Renewed: 4
UGSG looks at microbiology, chemistry of Pa. fracked wells - - From the U.S. Geological Survey today: In a study of 13 hydraulically fractured shale gas wells in north-central Pennsylvania, USGS researchers found that the microbiology and organic chemistry of the produced waters varied widely from well to well. The variations in these aspects of the wells followed no discernible spatial or geological pattern but may be linked to the time a well was in production. Further, the study highlighted the presence of some organic compounds (e.g. benzene) in produced waters that could present potential risks to human health, if the waters are not properly managed. Produced water is the term specialists use to describe the water brought to the land surface during oil, gas, and coalbed methane production. This water is a mixture of naturally occurring water and fluid injected into the formation deep underground to enhance production. Although the USGS investigators found that the inorganic (noncarbon-based) chemistry of produced waters from the shale gas wells tested in the Marcellus region was fairly consistent from well to well and meshed with comparable results of previous studies (see USGS Energy Produced Waters Project), the large differences in the organic geochemistry (carbon-based, including petroleum products) and microbiology (e.g. bacteria) of the produced waters were striking findings of the study. “Some wells appeared to be hotspots for microbial activity,” observed Denise Akob, a USGS microbiologist and lead author of the study, “but this was not predicted by well location, depth, or salinity. The presence of microbes seemed to be associated with concentrations of specific organic compounds — for example, benzene or acetate — and the length of time that the well was in production.” The connection between the presence of organic compounds and the detection of microbes was not, in itself, surprising. Many organic compounds used as hydraulic fracturing fluid additives are biodegradable and thus could have supported microbial activity at depth during shale gas production.
Dimock, PA Lawsuit Trial-Bound as Study Links Fracking to Water Contamination in Neighboring County - A recent peer-reviewed study published in the Proceedings of the National Academy of Sciences has confirmed what many fracking critics have argued for years: hydraulic fracturing for oil and gas can contaminate groundwater. The study’s release comes as a major class action lawsuit filed in the District Court for the Middle District of Pennsylvania in 2009 winds its way to a jury trial later this year. The lawsuit over fracking groundwater contamination pits plaintiffs based in Dimock, PA against Cabot Oil and Gas Corporation. For the study, researchers examined groundwater contamination incidents at three homes in Pennsylvania’s Marcellus Shale basin in Bradford County. As The New York Times explained, the water samples showed “traces of a compound commonly found in Marcellus Shale drilling fluids.” It’s not the first time fracking has been linked to groundwater contamination in northeastern Pennsylvania. And that brings us back to Dimock, , located in neighboring Susquehanna County. As DeSmogBlog revealed in August 2013, the U.S. Environmental Protection Agency (EPA) had in its possession an unpublished PowerPoint presentation summarizing an Agency-contracted study that linked fracking to groundwater contamination in Dimock, a study the Agency later abandoned and censored. That presentation was subsequently leaked and published here for the first time.In its official July 2012 Dimock desk statement, EPA said “there are not levels of contaminants present that would require additional action by the Agency.” As Greenpeace USA researcher Jesse Coleman recently pointed out, EPA has done the bidding of the oil and gas industry on multiple instances during high profile fracking studies.
Fracking may affect air quality and human health - People living or working near active natural gas wells may be exposed to certain pollutants at higher levels than the Environmental Protection Agency considers safe for lifetime exposure, according to scientists from Oregon State University and the University of Cincinnati. The researchers found that hydraulic fracturing - a technique for releasing natural gas from below-ground rock formations - emits pollutants known as PAHs (polycyclic aromatic hydrocarbons), including some that are linked with increased risk of cancer and respiratory ailments. "Air pollution from fracking operations may pose an under-recognized health hazard to people living near them," said the study's coauthor Kim Anderson, an environmental chemist with OSU's College of Agricultural Sciences. The study, which appears in the journal Environmental Science & Technology's online edition, is part of a larger project co-led by the University of Cincinnati's Erin Haynes, OSU's Anderson, her graduate student Blair Paulik and Laurel Kincl, director of OSU's Environmental Health Science Center. Anderson and her colleagues collected air samples from sites near active natural gas wells in Carroll County, Ohio, over a three-week period last February. Carroll The rural county is a hotspot of natural gas prospecting, with more than one active well site per square mile. They placed air samplers on the properties of 23 volunteers living or working at sites ranging from right next to a gas well to a little more than three miles away.
Fracking may cause air pollution, respiratory issues - (UPI) -- The explosion of hydraulic fracturing, or fracking, in the oil and natural gas industry as a method of extracting fuels from shale basins has raised dozens of environmental concerns including increased risk of air pollution and respiratory issues among them. A new study found that contaminants in the air from fracking exceed levels deemed safe by the Environmental Protection Agency and may pose health risks to those exposed. The study, conducted by researchers from Oregon State University, was conducted in Carroll County, Ohio, the busiest county for fracking in the state with 354 horizontal wells spread throughout its 399 square-miles. Fracking causes polycyclic aromatic hydrocarbons (PAHs) to be released as a byproduct of the process. Some of these are linked to cancer and respiratory ailments. "Air pollution from fracking operations may pose an under-recognized health hazard to people living near them," Kim Anderson, an environmental chemist with OSU's College of Agricultural Sciences, said in a press release. Researchers placed passive air samplers near 23 properties up to 3 miles from natural gas wells, testing for 62 PAHs over the course of three weeks. The samplers detected 32 PAHs, with levels decreasing further away from wells. Samples showed that those living or working closest to wells would be at 30 percent higher risk than those a mile or more away. The data showed, however, that anybody in the study area, based on calculations using the EPA's worst case scenario of exposure 24 hours a day for 25 years would be exposed at to a risk higher than what the agency says is acceptable.
Fracking may affect air quality and human health - People living or working near active natural gas wells may be exposed to certain pollutants at higher levels than the Environmental Protection Agency considers safe for lifetime exposure, according to scientists from Oregon State University and the University of Cincinnati. The researchers found that hydraulic fracturing emits pollutants known as PAHs (polycyclic aromatic hydrocarbons), including some that are linked with increased risk of cancer and respiratory ailments. The samplers picked up high levels of PAHs across the study area. Levels were highest closest to the wells and decreased by about 30 percent with distance. Even the lowest levels - detected on sites more than a mile away from a well - were higher than previous researchers had found in downtown Chicago and near a Belgian oil refinery. They were about 10 times higher than in a rural Michigan area with no natural gas wells. By looking at the ratios of individual PAHs detected by the samplers, Anderson and her team were able to discern whether they came directly from the earth - a "petrogenic" source - or from "pyrogenic" sources like the burning of fossil fuels. The proportion of petrogenic PAHs in the mix was highest nearer the wells and decreased with distance. The team also accounted for the influences of wood smoke and vehicle exhaust, common sources of airborne pyrogenic PAHs. Wood smoke was consistent across the sampling area, supporting the conclusion that the gas wells were contributing to the higher PAH levels. For the worst-case scenario (exposure 24 hours a day over 25 years), they found that a person anywhere in the study area would be exposed at a risk level exceeding the threshold of what the EPA deems acceptable.
Frackademia Takes The Heat - Scientific journal: SU prof paid by Chesapeake for pro-fracking study — A leading scientific journal has run a lengthy correction clarifying that a Syracuse University professor and his co-authors were paid by the gas industry on a recent study. Environmental Science & Technology says that SU prof Donald Siegel was paid by Chesapeake Energy for his work, and at least one of his co-authors worked for Chesapeake during the study period. The original article, published online last month, simply said “the authors declare no competing financial interest.” The article was favorable to gas drillers because it found that drinking wells in Pennsylvania had not been contaminated with methane from nearby fracking wells. The study was touted by pro-fracking activists as evidence that the process is safe. Anti-fracking activists say they didn’t trust the paper because the water samples were provided by Chesapeake and because Siegel and one of the co-authors, Bert Smith, had financial ties to the company.
New rules to protect threatened bats could affect natural gas site construction - Little bats that are being decimated by a big disease in 28 states are now protected by the Endangered Species Act as a threatened species, a decision that could impact oil and gas operations. The oil and gas industry has decried the possible effects that protecting the northern long-eared bat, effective May 4, under the act could have on their operations, while pointing out that other industries are not facing the same restrictions. The Independent Petroleum Association of America (IPAA) has stated that because the U.S. Fish and Wildlife Service enacted the listing in response to a fungal disease called white-nose syndrome, and not habitat change, drillers should not be subjected to increased restrictions for new projects. The disease, which can often be identified in advanced stages by a white fungus on the bats’ bodies, has decimated about 5.7 million northern long-eared bats since 2006. The wildlife service said in its ruling that the disease is “the predominant threat to the species.” However, not all industrial activities in the wild are under the same restrictions. The ruling also said that accidentally harming or killing the bats is prohibited, except during activities like removing small numbers of trees, managing forests and performing maintenance on transportation and utility right-of-ways. This exemption, known as a 4(d) rule, is an interim decision that benefits industries like the timber industry, but not natural gas drillers wishing to establish new well pads.
Nat gas prices are on the rise - The U.S. Energy Information Administration shared today that U.S. natural gas stocks have increased by 111 billion cubic feet for the week ending on May 1 and that storage will see a small increase of about 125 billion cubic feet. As reported by 24/7 Wall St., “Natural gas futures for June delivery traded down about 1.1% in advance of the EIA’s report, at around $2.90 per million BTUs, and jumped to around $3.02 (up about 4.1% for the day) following release of the report. Last Thursday, natural gas closed at $2.73 per million BTUs and natural gas futures have increased by about 6% over the past five trading days. The 52-week low for natural gas futures is $2.48. One year ago the price for a million BTUs was around $4.20.” Thanks to the cooler spring weather northern point of nation is experiencing, the demand for natural gas has witnessed a little boost. The line of cool weather is expected to travel down to Texas and other states in the southern region of the U.S. sometime this week and next week. This will also help cool off warmer parts of the nation, but will also keep the demand for natural gas low. The small increase in storage is believed to be due to lower natural gas production in the nation’s prominent shale plays. Earlier this week, the EIA released its drilling productivity report, which said, “It expects natural gas production to drop by 112 million cubic feet per day in June.”
Construction to begin on sixth LNG export facility in Corpus Christi | marcellus.com: Cheniere Energy, Inc. has announced that the ink on final investments is drying and the awaited liquefaction export project near Corpus Christi, Texas is on the road to completion. On Wednesday, the company’s Board of Directors made the call to Bechtel Oil, Gas and Chemicals, Inc. to commence construction of the first two natural gas liquefaction trains. The CCL Project is designed for up to three trains, according to Cheniere Energy. The first train is expected to start operations as early as 2018, with the second train expected to commence operations approximately six to nine months afterwards. According to reports, the new LNG project includes expected aggregate nominal production capacity of approximately 13.5 million tons per annum (mtpa), three LNG storage tanks with capacity of approximately 10.1 billions of cubic feet equivalent (Bcfe), two LNG carrier docks and a 22-mile, 48″ natural gas supply pipeline. “We have initiated construction on our second LNG export facility, the Corpus Christi liquefaction project, located on the Coastal Bend of Texas along the Gulf of Mexico. Including our LNG export facility at Sabine Pass, we now have six trains under construction, with first LNG expected at Sabine Pass from Train 1 by year end,” said Charif Souki, chairman and CEO of Cheniere in a press release. “For these major projects, getting to the point of commencing construction represents the culmination of years of dedicated hard work by all of our employees, Bechtel, other strategic partners, and legislative and government officials. We would like to thank all for their efforts and look forward to successful project execution in Corpus Christi.”
NY releases final environmental review of fracking — New York regulators have released the final version of an environmental impact review of shale gas development that’s expected to lead to a state ban on fracking. Gov. Andrew Cuomo said in December that he would defer to the judgment of his health and environmental conservation commissioners, who said they’d recommend a ban on high-volume hydraulic fracturing. Under state law, a formal decision on whether to allow or ban fracking will come 10 days after the environmental review’s release on Wednesday. The environmental review that was launched in 2008 drew more than 260,000 comments over the course of several revisions. No shale gas wells have been permitted during that time. A state health study released in December found “significant uncertainty” over whether safety measures could adequately protect public health.
We Are Seneca Lake: Josh Fox & Fracking Opponents Fight Natural Gas Storage Site in Upstate NY | Democracy Now! (video, interview & transcript) - Josh Fox: When Governor Andrew Cuomo banned fracking in New York state on December 17th, 2014, a lot of fracktivists in New York thought their problems were over. It was a tremendous victory, a precedent for other states, a landmark decision for public health and for the science on fracking. But not every decision about fracking in New York was being made at the state level. FERC, the Federal Energy Regulatory Commission, decides about pipelines, storage facilities and other interstate oil and gas infrastructure. Because FERC is in charge of so many projects, they’ve been heavily criticized for having a lack of public input and for simply being a rubber-stamp commission for the oil and gas industry. One of the decisions that FERC has under its control is the fate of Seneca Lake, New York. Seneca Lake is 600 feet deep, home to nearly a hundred wineries, breweries and distilleries, a tourist destination and drinking water for 100,000 people. Its beauty is breathtaking, its water resource invaluable. But it has one other fairly unique physical feature. Under the lake are salt caverns, where salt has been mined for decades, huge underground hollow expanses. A company called Crestwood is eyeing the salt caverns to stuff natural gas down as a kind of natural storage facility, as a way station, a hub, a port, for fracked gas from Pennsylvania, West Virginia, Ohio and other places throughout the region. Sandra Steingraber, one of the founders of New Yorkers Against Fracking and an incredibly influential and outspoken fracking critic, is working with a group called We Are Seneca Lake. Since October, they’ve been blockading the Crestwood facility with protests that are both colorful and imaginative. With over 250 arrests and counting, We Are Seneca Lake is becoming one of the largest environmental civil disobedience protests in New York history.
Enbridge Agrees To Pay $75 Million For Massive Kalamazoo River Tar Sands Spill - Canadian oil company Enbridge has agreed to pay $75 million for its role in a 2010 pipeline rupture that resulted in the largest inland oil spill in U.S. history. Enbridge settled with the state of Michigan this week over the Kalamazoo River oil spill, a disaster that sent more than 800,000 gallons of Canadian tar sands crude into the river. Under the settlement, the oil company will pay $30 million to restore or create 300 acres of wetlands, in an effort to help to improve the health of the Kalamazoo River. The spill affected 38 miles of the river itself and 4,435 acres of shoreline, according to the Detroit Free Press. $18 million of the settlement will go towards removing a dam and making other changes to help the river flow more naturally, $10 million will go towards building and maintaining more boating and recreation access sites to the river, and $5 million will go towards additional river restoration. The remaining $12 million will go towards reimbursing the state of Michigan for attorney costs, as well as for the state’s role in the cleanup and restoration of the river. The cleanup of the spill proved difficult and expensive — tar sands is thicker than conventional oil, so instead of floating on top of the river’s water it sank to the bottom. That meant that Endbridge had to dredge the bottom of the river and the river banks to try to remove the oil, and then plant native vegetation along the banks in an attempt to restore the surrounding land. Enbridge puts the cost of cleanup of the spill at $1.21 billion, a figure that’s $85.9 million higher the company first estimated. In spite of this cleanup, residents who live near the river still say they see residual oil in the river, and they won’t fish in it. “Anybody that’s aware there was an oil spill doesn’t go in the river. I would say 80 percent of the community is very aware that the water isn’t safe,”
Michigan earthquake provides teachable moment on fracking -- Last weekend's earthquake in Michigan was more novelty than natural disaster, a point made by a popular Facebook meme picturing a tipped-over lawn chair and a tongue-in-cheek slogan: "We WILL rebuild." Still, the event has proved to be a teachable moment on the link between fracking and earthquakes. While the fracking process can trigger earthquakes, most quakes are not related to fracking and the Michigan event is an example of the latter, not the former. "This looks like very normal plate tectonics," said Michael Brudzinski, a geophysics professor at Miami University in Ohio. Brudzinski, who has studied the fracking-earthquake issue, is one of six scientists I've interviewed this past week. That includes geoscientists from the U.S. Geological Survey, the Michigan Department of Environmental Quality, Michigan State University and two geoscientists from Western Michigan University. They all said the earthquake can be blamed on Mother Nature, not Big Oil.To be sure, scientists say there is no question that the process of drilling for oil or gas can trigger an earthquake in some circumstances.
Delfin LNG proposes nation's first offshore LNG facility - There have been numerous natural gas liquefaction and export facilities proposed for the Gulf Coast. But what about offshore? Delfin LNG LLC announced Monday that it has submitted applications to the Maritime Administration and the U.S. Coast Guard seeking approval for an offshore liquefaction and export station. The Delfin LNG Project has been proposed for a location roughly 50 miles from the coast of Cameron Parish, Louisiana. The project would feature four moored floating liquefied natural gas vessels (FLNGVs) with a collective annual export capacity of 443.3 billion cubic feet per year. “This is a very exciting step for Delfin and our partners in the project,” said the company’s founder, Frederick Jones, in a press release. “We believe that floating liquefaction technology is faster to market, more flexible, and more environmentally friendly than land based liquefaction terminals. As the first floating liquefaction project in North America, Port Delfin will be a significant development in the world’s evolving natural gas markets and a historic milestone for the U.S. oil and gas industry.” In addition to Port Delfin’s operations offshore, the company has proposed the construction of a compressor station on the Louisiana coast that would take advantage of pipeline infrastructure that is currently underutilized. The station would feed compressed natural gas to the offshore facility through already existing pipelines, cutting down on costs. The appropriate application for the compressor station has been filed with the Federal Energy Regulatory Commission.
Brother of Hillary Clinton's Top Campaign Aide Lobbied for Fracked Gas Export Terminal Co-Owned by Qatar --Anthony “Tony” Podesta began lobbying in late 2013 on behalf of a company co-owned by ExxonMobil and Qatar Petroleum aiming to export liquefied natural gas (LNG) to the global market. Tony is the brother of John Podesta, former top climate change adviser to President Barack Obama and current top campaign aide for Hillary Clinton’s 2016 bid for president. In October 2012, Podesta Group began lobbying on behalf of the proposed ExxonMobil-Qatar Petroleum Golden Pass LNGfacility in Sabine Pass, Texas, according to lobbying disclosure forms. The forms indicate that Tony Podesta himself, not just his staff, lobbied on behalf of the terminal beginning in quarter four of 2013. Tony Podesta’s name also shows up on the Golden Pass LNG lobbying disclosure forms for quarters one, two, three and four for 2014. During those quarters, Podesta lobbied for proposed federal legislation aiming to expedite the regulatory process for permitting LNG terminals. Lobbying disclosure forms for the first quarter of 2015 show that Podesta Group no longer lobbies on behalf of Golden Pass. The company now employs FTI Consulting’s Timothy Glassco to lobby for expedited permitting for LNGexport terminals. Glassco, a former staffer for Obama’s 2008 presidential run, recently departed after almost seven years on the job at Podesta Group, according to his LinkedIn profile. Glassco has lobbied for Golden Pass since the Podesta Group began lobbying for the company back in 2012, according to the federal lobbying disclosure database.
Details of the debate in US states on oil drilling, fracking: Clashes are growing between cities and states across America over oil and gas drilling and hydraulic fracturing, the practice of high pressure injections of water, sand and chemicals underground to free deposits of oil and gas. Energy-rich states are rushing to quash some of the local activism. Following is a summary of state debates. In Texas, which leads the nation in oil and natural gas production, a measure to limit local regulations to those deemed "commercially reasonable" has passed the Legislature and is expected to be signed into law by Republican Gov. Greg Abbott. Cities would be allowed to regulate surface activities such as noise, lights and traffic but not drilling itself. No less than 11 bills have been introduced to the Texas Legislature this session to put limits on local control. The Oklahoma House approved a wide-reaching bill last month that prohibits cities and towns from banning oil and natural gas drilling, or implementing restrictions that are not "reasonable." On the other side of the issue, New York state banned fracking statewide in December. In Pennsylvania, after fracking in the Marcellus Shale deposit began booming in 2008, the Legislature imposed a 2012 law restricting the ability of municipalities to dictate the location of drilling activity. The law was struck down by the state Supreme Court last year. After some Ohio cities passed municipal bans, that state's Supreme Court recently ruled the opposite, finding that the state had exclusive authority over all aspects of oil and natural gas drilling, including fracking. Colorado state law prohibits local ordinances that ban energy exploration such as fracking, but some towns have imposed them anyway, sparking lawsuits.
Oklahoma oil firms drilling but waiting to complete wells — Oklahoma energy companies are still drilling in spite of low oil prices, but they are putting off costly practices such as hydraulic fracturing until prices recover. Drilled uncompleted wells are a new trend in the oil patch, led both by lower oil prices and the drastic technological and procedural changes the industry has experienced over the past decade, The Oklahoman reported Sunday. Continental Resources Inc. CEO Harold Hamm has said completion processes typically represent about 60 percent of the cost of a modern shale well. “Why spend that money today to bring on production that’s going to be sold in a bad market? You don’t need to do that,” Hamm said at a recent energy summit in Houston. It’s difficult to track how many wells have been drilled and left uncompleted, in part because states have different reporting requirements. Wood Mackenzie Ltd. and RBC Capital Markets LLC in March estimated that more than 3,000 wells nationwide have been drilled but not completed. Data collected by Oklahoma City-based Oseberg indicates that companies are continuing to show interest in drilling wells. While the number of permitted wells has dropped in recent months, those numbers continue to far outpace the number of wells that have been fracked and completed.
Fracking Has Made Oklahoma the Earthquake Capital of the U.S. - With mounting evidence that the fracking industry is causing a dramatic rise in seismic activity in Oklahoma, a growing chorus is calling for a moratorium on the use of disposal wells. But the rapid increase in hydraulic fracturing has coincided with a surge in the number of earthquakes. It isn’t the fracking itself that is causing more seismic activity, but the practice of disposing wastewater that follows. The US Geological Survey has noted the connection. “The increase in seismicity has been found to coincide with the injection of wastewater in deep disposal wells in several locations, including Colorado, Texas, Arkansas, Oklahoma and Ohio,” USGS concluded on a section of its website entitled “Induced Earthquakes.” The USGS chart below notes the sudden rise in earthquakes since 2010, with many concentrated in Oklahoma. Oklahoma has been slow to recognize the link. Oklahoma experienced 585 earthquakes in 2014 with a magnitude of 3.0 or greater, skyrocketing up from 109 in 2013, and just a handful each year over the course of previous decades. Still, Oklahoma’s seismologists did not officially come out and make the connection between disposal wells and the state’s extraordinarily high frequency of seismic events until April of this year. But after an extended period of time in which top officials with the state of Oklahoma declined to acknowledge a connection between disposal wells and earthquakes – a connection that federal seismologists came to quite a while ago – the fact that the state now accepts the connection has lent credibility to the rising tide of criticism of wastewater disposal.
Researchers: Fracking Responsible for 4.0-Magnitude Texas Earthquake - A 4.0-magnitude earthquake rocked Northern Texas on Thursday as one of the most powerful earthquakes to strike the region since November 2013. Now, some scientists are speculating whether fracking, the controversial oil-drilling method, is responsible for this seismic activity. The earthquake hit at 5:58 p.m. near Venus, which sits about 30 miles southwest of Dallas. It was felt from southern Fort Worth and Arlington south to Hillsboro, according to the Associated Press. The earthquake came weeks after researchers from Southern Methodist University in Dallas testified before a state House committee that 27 earthquakes which struck northwest of Fort Worth during November 2013 and January 2014 are linked to fracking. Last month, Southern Methodist joined the United States Geological Survey of Texas to study a string of earthquakes that took place between 2013 and 2014 near the city of Azle seeking to gather evidence that the earthquakes were caused by man-made activity, specifically fracking. This earthquake struck in a region that has experienced more than 50 tremors since November 2013, according to the USGS. “The model shows that a pressure differential develops along one of the faults as a combined result of high fluid injection rates to the west and high water removal rates to the east," said Matthew Hornbach, associate professor of geophysics at SMU. "When we ran the model over a 10-year period through a wide range of parameters, it predicted pressure changes significant enough to trigger earthquakes on faults that are already stressed."
New Research Suggests Fracking Causes Earthquakes -- As previously reported by Inquisitr, the U.S. Geological study recently published a report indicating that the continued rise in hydraulic fracturing — better known by its colloquial name “fracking” — is “almost certainly” behind spates of earthquakes in Alabama, Arkansas, Colorado, Kansas, New Mexico, Ohio, Oklahoma and Texas. CNN reports that the Dallas, Texas area alone has experienced “almost 40 small earthquakes” in 2015, including a two-day stretch in early January in which 11 earthquakes were logged over the course of 24 hours. According to the Dallas Morning News, a 4.0 earthquake rattled Johnson County on Thursday, May 7. Johnson County is just south of the Dallas-Fort Worth area. Bolstering the USGS report linking fracking to quakes are the findings of a new Southern Methodist University-led research team, which indicate that drilling in parts of Texas “most likely” caused a number of earthquakes in the area over the course of recent years. State Column reports that SMU researchers are especially concerned that a small earthquake could lead to another, especially where fault-lines are involved. However, the Texas Railroad Commission, an organization that oversees oil and gas affairs in the state, has been hesitant to accept findings that link the fracking industry to seismic activity.
What's causing Texas earthquakes? Fracking 'most likely,' report says - According to the U.S. Geological Survey, the Dallas area has suffered almost 40 small earthquakes (magnitude 2.0 or higher) since the beginning of this year, the latest a magnitude-2.7 quake near Farmers Branch on Monday. Many of the epicenters were recorded in Farmers Branch and Irving, with a couple to the south in Venus."The quakes don't sound like much to somebody from California," Jim Wells told CNN. "But when you are sitting right on top of them, they are more than noticeable. They will shake the entire house, and you have no doubt about it when you have gone through it. We have in my home perhaps 100 or more wall hangings, pieces of art -- prints, etchings, oil originals -- and none of them are hanging straight."On January 7 and 8, Irving experienced 11 earthquakes in about 24 hours. During one of those quakes -- a magnitude 3.6 -- Gail Wells says the rattling and shaking were so intense it knocked her off the sofa.Susan Hough, a seismologist at the USGS and the California Institute of Technology, says the epicenter of these types of earthquakes would produce "average-to-high shaking intensities close in, but low intensities" about six miles out.The Wells' home sits less than a mile from the epicenter of some of the Irving quakes, and they say they've felt at least 15 of them this year. Though there hasn't been "serious" damage yet, Jim Wells is worried there will be if the quakes continue.
How to Prevent Man-Made Earthquakes - Studies, including two reports issued in April, indicate that human activities, including activities related to oil and gas extraction, are beginning to play a significant role in triggering earthquakes in the central U.S. It is important to note that it is not the fracking process itself that usually causes these earthquakes; it is the rapid injection of fluid during wastewater disposal that sometimes pumps hundreds of millions of gallons of brine deep into the earth each year. A recent peer-reviewed scientific study I co-authored concludes that human activities, specifically water production and wastewater injection, represent the most likely cause of earthquakes in the Azle/Reno, Texas, region, where significant gas production and wastewater injection began five years ago. But this is not a fundamentally new discovery. For nearly a century, industry and academic researchers have recognized that human activities can and do sometimes trigger earthquakes.. What is unique and exciting about our Azle/Reno study is the unprecedented support and cooperation of the energy industry, which in many instances provided mission-critical data, technical support and constructive scientific reviews to allow scientists to better assess, model and understand earthquakes in the Azle/Reno area and across Texas.In our instance, industry researchers went far beyond state regulatory requirements by providing insight into the location and orientation of regional faults, injection reservoir pressures and subsurface flow. As our study and many other studies, including those conducted by industry, suggest, the key to understanding and mitigating earthquake hazards in Texas and elsewhere is high-quality data, especially data that monitor and assess subsurface pressures, fluid injection volumes, fluid extraction volumes and regional seismicity over time. There have been studies to develop a general hazard model for injection wells, as well as specific strategies on how to reduce risk during and prior to the injection process. These strategies generally include the early detection and location of potentially weak faults, choosing appropriate injection reservoirs that minimize the risk of increasing underground pressure, and adjusting wastewater injection practices to reduce or minimize seismicity. Scientists can also collect more detailed brine production and injection data, underground pressure data and regional seismic data to better predict how subsurface pressures and associated seismicity might evolve with time. These techniques are already being implementing with success at known induced seismicity sites.
Oil Patch Layoffs on the Verge of Breaking Their Uptrend - With the spot price of West Texas Intermediate crude oil having broken above $50 in the second week of April 2015, it now appears that the rebound in oil prices has now put new jobless claims in the eight high cost oil production states we've been tracking on the verge of breaking what had been their statistical uptrend for layoffs. The various lines we show on this chart actually represent key thresholds in a statistical hypothesis test. While the data points fall within the outermost red lines, the null hypothesis for that test holds, which in this case, means that the upward trend for layoffs still holds and that all the variation from week to week is the simply result of random variation or "noise". But once the data points start falling outside of that range, it is a clear indication that our null hypothesis no longer holds and that the previous trend has broken down - something other than random factors has caused the data to fall consistently outside the range where we would expect it to be if the variation were just the result of randomness. In this case, there's an obvious explanation for why the previous rising trend for layoffs would break down: a reversal in the trend for oil prices for the eight states where high cost oil production represents a significant part of their local economies and job markets. With oil prices now rising, firms engaged in that economic activity are able to avoid having to lay additional workers off in order to remain solvent. Meanwhile, in the other 42 states, the trend of new jobless claims remains on its long established downward trend, which has been the case since oil prices began to fall beginning in early July 2014.
Riding the oil price roller coaster in New Mexico - There's always been oil in Eddy County. It's one of the major oil-producing counties in southeastern New Mexico, part of the Permian Basin that encompasses much of the West Texas oil patch. But in the last few years, fracking has opened up new deposits, with names like Bone Spring and Wolfcamp, and oil companies have been hiring firms like Marbach's Allied Land Services to find and purchase rights to do exploratory drilling. But fracking is also expensive, and the economic viability of any new wells rides on the price of oil. Not that Marbach was following it last year, when it was up near $100. "We were so busy and the companies kept ordering work, I didn't pay attention to it until it really started going down." Last fall, he watched it with increasing trepidation as it dropped to $90, $80, $70 a barrel. "When it went below $50, that's when they started pulling the plug on a lot of these projects," he says.That happened in January, when his oil company customers cut him off en masse. He had to fire half his staff."I had one young guy that moved here from Fort Worth just specifically to work for me, and I had to lay him off," he says. "That was... that was rough." Months later, oil has crept closer to $60, and his business is just starting to come back. You can see the mood in the records room of the county clerk's office where landmen like Marbach do much of their work. When oil was $100, Marbach says these tables were packed shoulder to shoulder, but now there are just four people at each, one of whom is Wesley Burnett—the guy Marbach fired. He spent a few unemployed weeks doing odd jobs and watching TV at home, but he's back doing land title research for oil companies.
H2-Uh Oh - I feel honored to be subject to the ministrations and machinations of a seasoned professional, such as Ms Madsen, and I hold no grudge for any distortions of half-truths on her part; that is, after all, her job. Quite a few of her assertions are in the category of being 100% half true. It is true, as she asserts, that more water is extracted/produced by gas and oil fracking than is injected into the well. In fact, much more–as much as 16 times more. It is also true that these waters are used in agriculture. All this must be good, right? What is left out is what is in these extracted waters. They contain the chemicals used to frack and acidify the wells. Therefore the chemical stew enters both directly into the food chain (our bodies) and eventually penetrate into the aquifer. But that’s not all folks. The waters also contain natural pollutants from having lived with oil for centuries underground. Besides the salts and strontium there is a natural, if undesirable, oiliness.But there’s no evidence that fracking liquids are either unsafe or in the aquifer, the letter asserts. Really? One may not like the evidence but it is evidence, non-the-less: Clean Water Action reports that extracted waste water (from fracking) is put into open pits untreated. They both off-gas, adding to air pollution, and penetrate the aquifer.According to NBC (Nov 2014) gas companies pump nearly three billion gallons of such wastewater directly into our aquifers. This act, NBC reported, is itself against the law, the aquifers being legally off-limits.
BLM Leases more than 30,000 acres of Pawnee and Front Range - The U.S. Bureau of Land Management secured a $32.1 million oil and gas lease Thursday that includes acreage on both the Front Range and Pawnee National Grassland, The Denver Post reports. Despite cautions from environmental groups, which accused the BLM of ignoring pollution and climate concerns, about 75 percent of the 33,000 acres will be located on Pawnee Grassland. The BLM reportedly sold 73 of the 86 land parcels, which included acreage in Arapahoe, Adams, Logan and Weld counties. The largest sale was a nearly 2,000 acre plot sold to oil and gas land acquisition company Ironhorse Resources LLC for $19.4 million. Revenue from the sales will be split between Colorado, which will receive 49 percent, and the federal government, which will receive the remaining 51 percent.“The Pawnee is a healthy prairie ecosystem, and federal lands on the plains are few and fair between,” said Jeremy Nichols, who heads the climate and energy program at WildEarth Guardians. WildEarth alleges that BLM proceeded without properly assessing potential damages to the ecology, which the BLM dismissed as “too speculative to be useful.”
Could Fracking Ruin Your Vacation? -- As the start of summer draws ever closer, Americans and international tourists will begin to flock to U.S. national parks, forests and other public lands for summer vacations, recreation and appreciation of our natural heritage. But there is something threatening the future of these lands and the communities that surround our national parks. Fracking. President Obama’s Bureau of Land Management finalized thin, new rules for regulating fracking on public lands back in March. When these rules were proposed in 2013, more than 650,000 public comments were delivered demanding an outright ban on the practice instead. By the end of 2014, oil and gas companies had leases on more than 34 million acres of U.S. public land. More than 200 million more acres—about a third of all federal land—can be targeted with drilling and fracking. Here are a few more key statistics taken from Food & Water Watch’s new fact sheet that was released yesterday:
North Dakota oil production up 12,500 barrels daily in March — North Dakota oil drillers produced an average of about 1.19 million barrels of oil a day in March. The Department of Mineral Resources says the March production was up about 12,500 barrels a day from February’s average. Western North Dakota’s oil patch had a record 12,430 producing wells in March, up from 12,199 in February. The state also produced 47.1 million cubic feet of natural gas in March. That’s up from 41.3 million cubic feet of natural gas in February. The average drill rig count in March was 108, down from 133 in February. Drilling activity has slowed in recent months with slumping oil prices. The number of drill rigs operating on Wednesday was 83.
North Dakota posts surprising jump in oil output in March – North Dakota posted a surprising jump in oil and natural gas output in March, as producers leaned on newer technologies and processes to offset a slump in commodity prices. Many industry observers had expected output to fall for the third consecutive month in the wake of a more than 50 percent drop in oil prices since last summer. “We scratched our heads in the month of March” as to why production increased, Lynn Helms, director of the state’s Department of Mineral Resources, said during a conference call with reporters. Yet the increase shows producers’ willingness to wring efficiencies out of existing operations, as well as their attempt to maintain production, even at depressed prices, to safeguard relationships with service providers ahead of any future spike in crude oil prices. About 189 North Dakota wells were completed in March at locations owned by Exxon Mobil Corp, Hess Corp, Continental Resources Inc and ConocoPhillips, reversing a trend in which most producers delayed completions. “These four appear to be more in tune with having normal cash flow, and continue to complete their wells in a more aggressive manner,” Helms said.
Oil well flare sprays oil, brine into ND river tributary — North Dakota health officials say a natural gas flare at an oil pad has sprayed a mix of oil and brine into a tributary of the east fork of the Little Muddy River. The North Dakota Department of Health says less than 42 gallons of the mix were sprayed into the river. The incident happened 10 miles northwest of Ray. The site is owned by Continental Resources, Inc. A representative for the company did not immediately return a call from The Associated Press seeking comment on the incident. Saltwater, or brine, is an unwanted byproduct of oil production. It’s many times saltier than sea water and can easily kill vegetation. Health Department inspectors are expected to visit the site to investigate the incident and determine a remediation plan.
WPX Energy would add North Dakota rigs with $65 per barrel oil – Oil and gas producer WPX Energy Inc would add one or two drilling rigs in North Dakota if WTI oil prices stabilized around $65 per barrel, Chief Executive Rick Muncrief told Reuters on Friday. The forecast falls in line with U.S. shale peers, several of whom have pointed to $65 to $70 per barrel as the range in which they would add rigs and ramp up production. Indeed, Muncrief’s comments add to a body of evidence that the United States is now the world’s swing oil producer, able to ramp production up or down quickly. For WPX specifically, Muncrief’s outlook is part of a broader strategy to show Wall Street that after years of bloated spending, cash flow and cost management are top priorities. It’s a focus that appears to be working: WPX’s stock is up 15 percent so far this year, compared with a nearly 3 percent rise in the S&P 500. “If we saw some stability in oil prices around the $65 WTI level, we would probably be more apt to add rigs,” Muncrief said in an interview on the first anniversary of taking the top job at WPX.
Shale-Oil Producers Ready to Raise Output - After slashing the number of drilling rigs for months, U.S. shale-oil companies say they are ready to bring rigs back into service, setting up the first big test of their ability to quickly react to rising crude prices. Last week, EOG Resources Inc. EOG -0.95 % said it would ramp up output if U.S. prices hold at recent levels, while Occidental Petroleum Corp. OXY 0.16 % boosted planned production for the year. Other drillers said they would open the taps if U.S. benchmark West Texas Intermediate reaches $70 a barrel. WTI settled at $60.50 Wednesday, while global benchmark Brent settled at $66.81. An increase in U.S. production, coupled with rising output by suppliers such as Russia and Brazil, could put a cap on the 40% rally in crude prices since March and even push them lower later in the year, some analysts say. “U.S. supply could quickly rebound in response to the recent recovery in prices,” said Tom Pugh, a commodities economist at Capital Economics. “Based on the historical relationship with prices, the fall in the number of drilling rigs already looks overdone, and activity is likely to rebound over the next few months.” One factor will be whether shale companies can quickly pump more oil. AdvertisementShale producers drill into oil-rich rock horizontally, then break it up with water and sand to extract the fuel. The cost to get oil out of these wells varies widely. But producers can stagger outlays, for instance, by drilling but then waiting to pump the oil when market prices are optimal or extraction costs are lower.
US taxpayers subsidizing world's biggest fossil fuel companies - The world’s biggest and most profitable fossil fuel companies are receiving huge and rising subsidies from US taxpayers, a practice slammed as absurd by a presidential candidate given the threat of climate change. A Guardian investigation of three specific projects, run by Shell, ExxonMobil and Marathon Petroleum, has revealed that the subsidises were all granted by politicians who received significant campaign contributions from the fossil fuel industry. The Guardian has found that:
- A proposed Shell petrochemical refinery in Pennsylvania is in line for $1.6bn (£1bn) in state subsidy, according to a deal struck in 2012 when the company made an annual profit of $26.8bn.
- ExxonMobil’s upgrades to its Baton Rouge refinery in Louisiana are benefitting from $119m of state subsidy, with the support starting in 2011, when the company made a $41bn profit.
- A jobs subsidy scheme worth $78m to Marathon Petroleum in Ohio began in 2011, when the company made $2.4bn in profit.
“At a time when scientists tell us we need to reduce carbon pollution to prevent catastrophic climate change, it is absurd to provide massive taxpayer subsidies that pad fossil-fuel companies’ already enormous profits,” said senator Bernie Sanders, who announced on 30 April he is running for president . Sanders, with representative Keith Ellison, recently proposed an End Polluter Welfare Act , which they say would cut $135bn of US subsidies for fossil fuel companies over the next decade. “Between 2010 and 2014, the oil, coal, gas, utility, and natural resource extraction industries spent $1.8bn on lobbying, much of it in defence of these giveaways,” according to Sanders and Ellison . In April, the president of the World Bank called for the subsidies to be scrapped immediately as poorer nations were feeling “the boot of climate change on their neck”. Globally in 2013, the most recent figures available,the coal, oil and gas industries benefited from subsidies of $550bn , four times those given to renewable energy.
What would it take to free U.S. oil exports? -- Lawmakers pushing to repeal the 1970s-era ban on U.S. oil exports face a steep obstacle: The Obama administration sees no need to fully remove the restriction while the country is still importing part of its oil supply. And many politicians are wary of a voter backlash if gasoline prices go up just as they open the door to exports. However, Senator Lisa Murkowski, the Republican head of her chamber’s energy committee, is expected to introduce a bill as soon as Tuesday night that would lift the ban Congress passed in 1975 after the Arab oil embargo created fears of global shortages. Mainly because of the U.S. oil glut, domestic crude producers now get about $6 a barrel less than companies in many other countries. If the glut grows and deepens the discount of West Texas Intermediate futures in New York to London’s Brent oil futures by between $10 and $15 a barrel or more, it would create a dislocation politicians would find hard to ignore. “I am not sure that policy makers will act in advance of that problem developing,” “In response to that kind of market dislocation, people will feel very pressured to act.”A bill introduced in February by Representative Joe Barton, a Texas Republican, has slowly gained backing and now has 26 co-sponsors in the 435 member chamber, including four Democrats. It could see a surge in support if more Representatives from non-energy producing states sign on.
U.S. set to get more accurate oil production data:- “The data must be wrong,” according to veteran oil analyst Phil Verleger, who wrote in a blistering note that the Energy Information Administration is probably overestimating U.S. oil production by 1.6 million barrels per day. Verleger argues substantially lower U.S. production is the most likely explanation for why global stocks are not rising as fast as predicted and discounts for storing barrels are narrowing. Other reasons why the stock build is smaller and the forward price structure is firmer could be stronger demand and/or more oil stockpiling in developing countries. But if Verleger is correct, U.S. production would be only 7.7 million barrels per day (bpd) compared with the 9.3 million bpd reported in the agency’s most recent weekly and monthly statistics. In practice, it is highly unlikely EIA is making an error as large as 1.6 million bpd in its statistics on domestic oil production, but Verleger has drawn attention to the well-known shortcomings in this area of the data. The figures on U.S. oil production are subject to much more uncertainty than the figures for oil stocks, refinery throughput and imports because the EIA has to rely on state-level data rather than its own surveys. All that could be about to change: EIA has received approval from the White House to launch its own mandatory monthly survey of oil and condensate production. The first of the new survey forms have gone out and respondents are beginning to submit the data. It will take a few months for the agency to vet the results for data quality but the first survey data could be published in the next few months.
Are Dangerous Bomb Trains Rolling Through Your City? - This week in Heimdal, North Dakota another “bomb train” derailed and exploded. These dangerous trains carrying crude-oil fracked in the Bakken Shale are rolling through the backyards of America, across rivers and streams and into major cities like Pittsburgh, Pennsylvania and Albany, New York. Our Video of the Week from documentary filmmaker Jon Bowermaster exposes the daily threat that many Americans are now living with as the oil and gas industry continues its desperate and dangerous expansion of extreme fossil fuel development in America. You can see if dangerous bomb trains are rolling through your town here. Lee’s from Pittsburgh, so we looked them up first. Pittsburgh has bomb trains coming in and out on all sides. The red is 0.5 Mile U.S. Department of Transportation Evacuation Zone for Oil Train Derailments and the yellow is 1.0 Mile U.S. Department of Transportation Potential Impact Zone in Case of Oil Train Fire. It’s a terrifying map to look at. We’ve been looking at a lot of maps recently. Maps of bomb train routes. Maps of proposed pipelines and other infrastructure projects like LNG ports and gas-fired power plants. Maps of fracking wells and areas where fracking earthquakes are popping up like crazy.Looking at all these maps, We see each community that has been put on the fossil fuel chopping block and think about the people we know who are now forced to live their lives in these danger zones. Looking at map after map, we can also see the bigger picture of fossil fuel domination as it expands across our country, a dangerous web of pipelines and train tracks that connect fracking well pads to the rest of the world, threatening us all.
Latest 'bomb train' incident predictable - BNSF Railway carried the Hess Corp.-owned rail car, which carried highly volatile Bakken crude oil from North Dakota and appears to have followed the law. President Barack Obama weighed and rejected using executive authority to curb the transport of this explosive crude oil, rich in butane and propane, because he decided North Dakota state law should be the controlling authority. But the law North Dakota passed in December and went into effect just last month, only requires less than 13.7 pounds-per-square-inch vapor pressure inside the tanker, despite explosions at lower pressures. That’s almost 40 percent more than the average vapor pressure among the 63 tanker cars that exploded July 6, 2013, at Lac-Megantic, Quebec. That disaster killed 47 people, some of whom could not be found because they were vaporized, and is driving recent federal and state rail car regulations. According to an Albany, N.Y., Times Union investigation, the average vapor pressure among 72 tanker cars in the Lac-Megantic train was 10 psi. Hess Corp. tested the crude just before loading at 10.8 psi, according to Associated Press reporters Matthew Brown and Blake Nicholson, in their follow-up story about the derailment at Heimdal, N.D. While federal regulations only require flash point and boiling point to be measured, North Dakota now requires vapor pressure be measured. But measuring and labeling the danger does not make transporting it safe.
Experts: Train explosions won't stop under new rules - When a train hauling volatile crude oil derailed near Galena in March, witnesses said it took about only an hour for tank cars to explode, sending giant fireballs hundreds of feet into the sky. Authorities said the tank cars survived the derailment intact, only to be engulfed in a flaming pool of oil that leaked from damaged cars and was ignited by a spark. The heat built up so much pressure within the cars that they blew up. "If we could have stopped other tank cars from being impinged, it would have helped," Galena Fire Chief Randy Beadle said. "But once that first one opened up, we had to let it all burn itself out." The federal government on May 1 unveiled new regulations aimed at making tank cars stronger to survive such fiery derailments, but critics say the new rules don't provide adequate protection against fire and heat, factors that cause cars to explode. New and retrofitted tank cars must have thermal insulation and pressure relief valves to protect against heat and flames, under the updated standards, but the U.S. Department of Transportation retained a 20-year-old standard when it came to how long tank cars should be able to survive in a fire. Instead of imposing a tougher regulation, as some sought, the department allowed to stand a rule that tank cars be able to survive being engulfed in a pool-type fire a minimum of 100 minutes without failing. That regulation wasn't written with crude oil in mind, experts and industry officials say. Firefighters argue the new measures are inadequate when dealing with the threat posed by the multitude of mile-long oil trains that cross the country and pass through Chicago each day.
Oil Industry Suing U.S. Govt. Over Oil Train Safety Rules - America’s largest energy trade association is suing the US government, contending that its timeline for upgrading oil tank cars for freight trains isn’t realistic and, in some cases, is too expensive. In its suit filed on May 11 in the US District Court of Appeals for the District of Columbia, the American Petroleum Institute (API) asked the panel to block the new regulations, issued May 1 by both Canada and the United States, that would require reinforcing the tank cars and fitting them with advanced braking systems. The companies that build the cars, or those that have already leased them, were given between five and ten years to retrofit cars, called DOT-111 tank cars, that carry crude oil and other flammable liquids, depending on the nature of their intended cargo and each car’s current set of safety features. The API said that timeline doesn’t give them enough time to make the upgrades. It also said the cost of installing new electronic braking systems of the cars exceeded their benefits. API spokesman Brian Straessle argued that “retrofit timelines, braking systems and other actions must all be based on facts and science to maximize the safety impact of this rule.”
U.S. green groups sue in challenge to oil train safety rules - : Seven environmental groups filed a lawsuit on Thursday challenging safety rules issued earlier this month for trains carrying oil, arguing the regulations are too weak to protect the public. The groups, including the Sierra Club and Center for Biological Diversity, charge that the rules, issued on May 1, will allow industry to continue to use “unsafe tank cars” for up to 10 years and fail to set adequate speed limits for oil trains. “We’re suing the administration because these rules won’t protect the 25 million Americans living in the oil train blast zone,” said Todd Paglia, executive director for ForestEthics, one of the groups bringing the lawsuit. The United States and Canada issued the safety standards in response to the string of explosive accidents that have accompanied a surge in crude-by-rail shipments. Under the rules, tank cars built before October 2011 known as DOT-111 will be phased out within three years. DOT-111 tank cars are considered prone to puncture during accidents, increasing the risk of fire and explosions. Tank cars without reinforced hulls built after October 2011 and known as CPC-1232 will be phased out by 2020. In their filing, the green groups asked the 9th U.S. Circuit Court of Appeals to force the Transportation Department to reconsider the “unduly long phase-out period” for these tank cars, as well as the speed limit and public notification requirements in the rule.
US says Gulf oil spill could last 100 years - — A decade-old oil leak where an offshore platform toppled during a hurricane could continue spilling crude into the Gulf of Mexico for a century or more if left unchecked, according to government estimates obtained by The Associated Press that provide new details about the scope of the problem. Taylor Energy Company, which owned the platform and a cluster of oil wells, has played down the extent and environmental impact of the leak. The company also maintains that nothing can be done to completely eliminate the chronic oil slicks that often stretch for miles off the coast of Louisiana. Taylor has tried to broker a deal with the government to resolve its financial obligations for the leak, but authorities have rebuffed those overtures and have ordered additional work by the company, according to Justice Department officials who were not authorized to comment publicly by name and spoke only on condition of anonymity. Federal regulators suspect oil is still leaking from at least one of 25 wells that remain buried under mounds of sediment from an underwater mudslide triggered by waves whipped up by Hurricane Ivan in 2004. A Taylor contractor drilled new wells to intercept and plug nine wells deemed capable of leaking oil. But a company official has asserted that experts agree the "best course of action ... is to not take any affirmative action" due to the risks of additional drilling. An AP investigation last month revealed evidence that the leak is far worse than Taylor, or the government, has publicly reported during a secretive response to the slow-motion spill. The AP's review of more than 2,300 Coast Guard pollution reports since 2008 showed a dramatic spike in sheen sizes and oil volumes since Sept. 1, 2014.
One Of The World’s Most Pristine Coral Reefs Could Open For Drilling - A World Heritage Site could turn into an oil drilling site, if plans to allow oil exploration off the coast of Belize go through. A proposal from the Belize Ministry of Energy provides guidelines for oil exploration — and drilling, if oil is found — across most of the country’s land and water, including along the Belize Barrier Reef, one of the world’s most ecologically diverse environments. Oceana Belize, an environmental advocacy group, has launched a campaign to halt oil exploration and to get more information from the government about the plan and what went into creating it. “The general consensus we’re getting from Belizeans is… ‘Didn’t we already decide not to do this? Why is this still an issue?'” Janelle Chanona, a spokesperson for Oceana Belize, told ThinkProgress.Two years ago, the Belize Supreme Court ruled in favor of an Oceana suit to halt offshore oil exploration. Subsequently, though, the injunction was suspended, and two companies, including Princess Petroleum, continue to have exploration rights.According to documents submitted by Belize to UNESCO, the original concession included exploration rights at Great Blue Hole, a renowned underwater sinkhole, but Princess Petroleum voluntarily gave rights to that area up. If oil is not found, the current rights will expire in October 2015, which may be why the government is pursuing a new path to concessions. The Belize Barrier Reef Reserve System — made up of mangrove forests, tiny islands, and the famous Blue Hole Natural Monument — is recognized by UNESCO as a World Heritage site, and as “one of the most pristine reef ecosystems in the Western Hemisphere.”
Grabbing Paddles in Seattle to Ward Off an Oil Giant - — A dozen or so men and women, cinched into life jackets, paddles at the ready, were about to launch their kayaks into Elliott Bay early Thursday evening with Seattle’s glittering skyline as the backdrop. For some of the paddlers, it was a first-time experience, and with the water at 50 degrees and choppy, there were some obvious signs of trepidation.“O.K., what hazards are we watching for?” Elizabeth Chiaravalli, their instructor, shouted, and a smattering of answers immediately bounced back. “The waves!” “The dock!” “The pilings!”Then Cynthia Orr, a 67-year-old mental health counselor, spoke up. “Shell Oil!” she cried, standing by her boat. Her fellow kayakers — or kayaktivists, as they call themselves — roared.The standoff between Royal Dutch Shell, which proposes to lease a terminal in the Port of Seattle for its Arctic drilling fleet, and the opponents who want to block the company’s plans for environmental and other reasons, is going aquatic. The various groups organizing a “ShellNo Flotilla” for Saturday hope to attract 1,000 kayaks or other small boats, and are arranging temporary housing for people coming from elsewhere to train and participate.
Obama Administration Approves Shell’s Plan to Drill in the Arctic The Obama administration gave conditional approval today to Shell to start drilling for oil and gas in the Arctic Ocean this summer. Shell has been fighting for the right to drill in the Arctic for years, despite a number of botched forays in recent years, and it looks like they are still going to get their way. Last month, the Department of the Interior opened the door to selling offshore drilling leases in the Arctic, even though a court-ordered re-analysis showed that the environmental impacts could be far worse than previously thought. The decision is a devastating blow to environmentalists, who have pressed the Obama administration to reject proposals for offshore Arctic drilling. “Instead of holding Shell accountable and moving the country towards a sustainable future, our federal regulators are catering to an ill-prepared company in a region that does not tolerate cutting corners,” said Greenpeace senior research specialist Tim Donaghy. “Shell has a history of dangerous malfunctioning in the Arctic while global scientists agree that Arctic oil must stay in the ground if we’re to avoid catastrophic climate change.” Michael Brune at the Sierra Club agrees. “We are deeply disappointed that just days after the United States took over chairmanship of the Arctic Council, an international body dedicated to protecting the Arctic environment, the Obama Administration decided to allow Shell to move forward with its dirty and dangerous plan to drill in our Arctic waters,” Brune said. “This is exactly the wrong message to send to the world.
Obama Administration Says Yes To Drilling In The Arctic - On Monday, the Department of Interior’s Bureau of Ocean Energy Management (BOEM) approved Shell’s exploration plan for the Chukchi Sea, which entails drilling up to six wells approximately 70 miles northwest of Wainwright, Alaska. The plan is for exploratory drilling, a sort of first step that companies take to determine whether a region is feasible for large-scale production. In announcing the conditional approval, BOEM cited its recently-issued safety regulations for drilling in the U.S. portion of the Arctic Ocean, including the Chukchi Sea, where big oil companies have long been hoping to lay their claim. Those regulations require companies to have contingency plans for mishaps — companies must be able to “promptly deploy” emergency containment equipment to deal with a spill, and must build a second rig close to their initial operations so a relief well could be drilled in the event of a blowout, among other things. “We have taken a thoughtful approach to carefully considering potential exploration in the Chukchi Sea, recognizing the significant environmental, social and ecological resources in the region and establishing high standards for the protection of this critical ecosystem, our Arctic communities, and the subsistence needs and cultural traditions of Alaska Natives,” BOEM Director Abigail Ross Hopper said in a statement. “As we move forward, any offshore exploratory activities will continue to be subject to rigorous safety standards.” Still, environmental groups are not satisfied with those precautions, arguing that the Arctic is too remote, sensitive, and unpredictable an environment to expose to the risks of drilling. They point to an analysis by BOEM itself that showed a 75 percent chance of a spill greater than 1,000 barrels should an oil company like Shell discover and fully produce oil in the Chukchi leases. They also note that the closest Coast Guard station that could respond to a spill is more than 1,000 miles away. “It’s outrageous how our own government appears determined to sacrifice our precious Arctic Ocean for Shell’s profits,”
Shell hopes to begin Arctic oil drilling project this summer- The Obama administration on Monday announced conditional approval for Shell Gulf of Mexico Inc. to resume its long and troubled efforts to drill for oil in the Arctic Ocean, prompting a backlash from environmental groups that warned of the risks of operating in the extreme conditions off Alaska. Shell, which says it has spent about $7 billion on its exploratory efforts in recent years, hopes to begin drilling this summer, but there is no assurance that it will. The company had received federal permission to drill in the past only to see its plans interrupted by legal challenges, technical problems and the formidable perils of working in the remote Arctic. Amid stormy conditions on New Year’s Eve 2012, a Shell drill rig broke free from a tow line and ran aground in the Gulf of Alaska. Last year, Shell abandoned plans to pursue summer drilling after a federal appeals court found that the permitting process had been flawed. This time, according to the Bureau of Ocean Energy Management, the federal agency that oversees offshore drilling, Shell and government regulators are better prepared. The agency approved a Shell plan to drill as many as six exploratory wells, starting with two this summer, in a section of the Chukchi Sea called the Burger Prospect, about 70 miles northwest of the village of Wainwright, Alaska. The approval, although conditional, is essential to setting in motion a round of permitting that Shell must complete before it can begin drilling.
Port says to hit brakes; Shell rig coming anyway - Shell Oil says its offshore oil rigs will arrive shortly on Seattle’s waterfront to prepare for drilling in Alaska, despite a Port of Seattle resolution Tuesday asking it to delay while the Port challenges a city ruling aimed at keeping the rigs out. “Rig movement will commence in the days to come,” said Shell spokesman Curtis Smith in an email. Foss Maritime CEO Paul Stevens, whose company is slated to work on the Shell rigs at Terminal 5, was equally blunt: “We are going to proceed… These rigs and our operation will be in and out of here before there is any conclusion on the appeal process.” He said the first of the two drilling ships will arrive Thursday. The Port of Seattle commission voted Tuesday to appeal the city’s interpretation that the Port needs a new permit to host Shell’s fleet. But the commission also asked Foss to inform Shell that use of the terminal should be delayed pending that legal review. The Shell spokesman said the company has only a short window available to work in the Arctic, and believes the Foss lease and supporting contract are valid, so it intends “to utilize Terminal 5 under the terms originally agreed upon by the parties involved — including the Port of Seattle.” The commission vote came after three hours of public comment from 74 speakers with stakes in the decision. Along with environmentalists and members of the community worried about the risks that oil drilling pose to the environment and carbon emissions, there were speakers who flew down from Alaska to explain the importance of drilling to their state, and members of Seattle’s maritime community.
Plan OK'd to drill into BP's ill-fated Macondo reservoir - — Deep-water drilling is set to resume near the site of the catastrophic BP PLC well blowout that killed 11 workers and caused the nation’s largest offshore oil spill five years ago off the coast of Louisiana. A Louisiana-based oil company, LLOG Exploration Offshore LLC, plans to drill into the Macondo reservoir, according to federal records reviewed by The Associated Press. Harper’s Magazine first reported the drilling plans late Tuesday. LLOG’s permit to drill a new well near BP’s site was approved April 13 by the Bureau of Safety and Environmental Enforcement, an agency overseeing offshore oil and gas drilling operations. The company’s exploration plan was approved last October following an environmental review by a sister agency, the Bureau of Ocean Energy Management. The company, a privately owned firm based in Covington, Louisiana, will be looking to extract oil and gas deep under the Gulf of Mexico’s seafloor, an undertaking that proved catastrophic for BP. “Our commitment is to not allow such an event to occur again,” said Rick Fowler, the vice president for deep-water projects at LLOG. “LLOG staff keeps the memory of what happened … fresh in our minds throughout our operations, both planning and execution.”
Oil Sands Land Becomes Alberta’s Hot Real Estate as Oil Rebounds - An indication that crude’s recent rally has further to run can be found in the northern forests of Alberta, where companies are paying the most in eight years to lease land for oil sands development. Auctions attracted the highest prices since 2007 in the first four months of the year even as Canadian heavy oil slid below $30 a barrel, from $87.23 in June, and producers from Cenovus Energy Inc. to Royal Dutch Shell Plc slashed spending and jobs. The trend is a sign that companies see the decline to a six-year low in March as temporary. Western Canadian Select crude has bounced back, gaining about 70 percent since March, almost twice as much as U.S. oil futures, amid rising demand for heavy oil from American refiners. Producers are more efficient than before the downturn after companies including Canadian Natural Resources Ltd. cut costs as much as 20 percent. “Right now it makes a great deal of sense to go in and acquire rights in the oil sands,” Trevor Newton, chairman of Strata Oil & Gas Inc., said in a phone interview. “Let’s get this now while we can. We are going to get them cheaper.” The province holding most of Canada’s crude reserves, the world’s third largest, drew an average of C$476.14 per hectare ($160 per acre) in offerings of rights through April, the most seasonally since 2007, data on the province’s website show.
Revealed: FBI violated its own rules while spying on Keystone XL opponents --The FBI breached its own internal rules when it spied on campaigners against the Keystone XL pipeline, failing to get approval before it cultivated informants and opened files on individuals protesting against the construction of the pipeline in Texas, documents reveal. Internal agency documents show for the first time how FBI agents have been closely monitoring anti-Keystone activists, in violation of guidelines designed to prevent the agency from becoming unduly involved in sensitive political issues. The hugely contentious Keystone XL pipeline has been strongly opposed for years by a coalition of environmental groups, including some involved in nonviolent civil disobedience who have been monitored by federal law enforcement agencies. The documents reveal that one FBI investigation, run from its Houston field office, amounted to “substantial non-compliance” of Department of Justice rules that govern how the agency should handle sensitive matters. One FBI memo, which set out the rationale for investigating campaigners in the Houston area, touted the economic advantages of the pipeline while labelling its opponents “environmental extremists”.Between November 2012 and June 2014, the documents show, the FBI collated inside knowledge about forthcoming protests, documented the identities of individuals photographing oil-related infrastructure, scrutinised police intelligence and cultivated at least one informant.It is unclear whether the source or sources were protesters-turned-informants, private investigators or hackers. One source is referred to in the documents as having had “good access and a history of reliable reporting”.
Crude rally about to sputter? --There is a distinct possibility that the recent oil rally is about to run out of steam. We have two potential issues on the horizon for crude markets:
- 1. The physical market seems to be facing challenges - which is a disconnect from the futures market. Reuters: - Tens of millions of barrels are struggling to find buyers in Europe with traders of West African, Azeri and North Sea crude blaming poor demand. The deep disconnect between the oil futures and physical markets looks similar to the events of June 2014 when the physical market weakness became a precursor for a futures price crash. "Being large physical buyers of crude we have a direct pulse of the market and feel immediately when it is well supplied, as is happening now," "In the short-term, futures prices do not necessarily reflect accurately the physical market."
- 2. While US oil rig count continues to decline (see chart), the recent price increases have been sufficient to bring some rigs back online. Bloomberg: - For the first time in five months, a rig in the Williston Basin, where North Dakota’s Bakken shale formation lies, sputtered back to life and started drilling for crude once again. And then one returned to the Permian Basin, the nation’s biggest oil play, field services contractor Baker Hughes Inc. said Friday. Some forget that in the current price environment US firms are pushing rig efficiency to new levels and the cost curve is expected to shift lower.
This is not the oil rally you’re looking for -- Izabella Kaminska - Goldman’s commodity analysts are out with their take on last week’s oil price rally, which saw Brent oil trade just shy of $70 per barrel. But they’re not sold on the idea that the rally has legs, describing it ultimately as self-defeating. Furthemore, they add, the move up to $70 was probably an over-reaction.As the note on Tuesday explains, the issue is that US rig curtailment hasn’t been anywhere near large enough to put production on a persistent downward trend, meaning the supply overhang suspended in “fracklog” continues to threaten the market with an additional 250 kb/d of production at any given moment. Here’s the relevant report chunk: Further, recent Saudi, Iraq and Russia production growth has surprised to the upside and we expect this trend to continue as this represents the next logical step to raising revenues in the New Oil Order. This growth helps offset declining production elsewhere, with risk to our flat Iranian production path skewed to the upside. As a result, we believe that the recent price rally is premature. In fact, we believe that should WTI remain near $60/bbl, US producers would eventually ramp up activity, hedge and complete wells, given improved returns with costs down by at least 20%. We therefore believe that prices need to sequentially weaken, to resume the oil market rebalancing as well as help correct the still intact imbalance of too much capital looking for opportunities in the energy space. The longer this price decline takes to materialize, the greater the upside risks to our already projected high inventories into 2016, especially in the US. With evidence at hand that US producers responded aggressively to low prices, the burden of proof has nonetheless shifted to how they will respond to the recent recovery and whether low-cost producers can sustainably deliver higher production. This may as a result delay the sequential decline in prices until this fall as we approach seasonally stronger summer demand which will also help temper the petroleum product inventory build. The shift of the crude surplus into a product surplus, however, will be the additional driver to lower crude prices as rising product stocks will depress refining margins globally.
Oil pares gains despite crude inventory draw: Oil prices pared gains after initially spiking on Wednesday as the U.S. government reported crude stocks fell for the second consecutive week, while gasoline and distillate inventories declined. U.S. crude inventories fell by 2.2 million barrels in the last week, compared with analysts' expectations for an increase of 386,000 barrels, according to a report by the Energy Information Administration. Crude stocks at the Cushing, Oklahoma, delivery hub fell by 990,000 barrels, EIA said. Refinery crude runs fell by 379,000 barrels per day, EIA data showed. Refinery utilization rates fell by 1.8 percentage points. Gasoline stocks fell by 1.1 million barrels, compared with analysts' expectations in a Reuters poll for a 429,000 barrels gain. Brent for June was up 64 cents at $67.50 a barrel by 10:39 a.m. (1439 GMT). Brent hit a high of $69.63 on May 6, its strongest since December. U.S. crude was up 49 cents at $61.24.
Crude Prices 'Spike' Despite Saudis Increasing 'Surge' Production -- As Barclays recently noted, there is a complete decoupling between futures and physical markets for crude oil and nowhere is that more evident than the high volume spike in crude that just happened after Saudi Arabia boosted crude production for a second month to the highest level in at least three decades, helping to raise OPEC output as U.S. growth showed signs of slowing. As Bloomberg reports, Saudi Arabia boosted crude production for a second month to the highest level in at least three decades, helping to raise OPEC output as U.S. growth showed signs of slowing. The Middle Eastern country increased daily crude output by 13,700 barrels in April to an average of 10.308 million, according to data the country communicated to the Organization of Petroleum Exporting Countries’ secretariat in Vienna. Prices collapsed by almost half last year as Saudi Arabia led OPEC in maintaining production rather than cede market share to booming U.S. output. The group has become more unified about keeping its daily output target of 30 million barrels because prices are now rising, according to Kuwait’s oil minister. Oil in New York has surged more than 40 percent from its March low amid as U.S. drillers pulled a record number of rigs from fields. “The Saudis must be content that their policy of protecting their market share has worked so well and prices did not stay below $50 for long,”said Christopher Bellew, senior broker at Jefferies International Ltd. in London, who had not seen the report. “They held their nerve and now see a stable market with their share preserved.”
Oil Jumps Above $61 After API Shows Larger-Than-Expected Inventory Draw -- Following last week's biggest inventory draw since September 2014 of 3.88 million barrels, expectations were for a relatively small 250k draw this week (with builds in gasoline and distillates). API reported a considerably bigger than expected 2 million bbl draw (with a 827k draw from Cushing). WTI Crude has pushed up above $61 on the news. (graphs)
Crude Pumps & Dumps After Inventory Draw Slows & Production Rises - Following API's data lastnight, DOE reported a 2.19 million barrel draw (more than expected) this week, crude oil prices immediately extended gains. However, that ramp quickly faded once it set in that the draw was actually notably lower than last week's. For some context, this leaves the total inventory still a near record 30% above average for this time of year. Prices were also not helped as total crude production rose modestly WoW.
US oil and natural gas rig count drops by 6 to 888 - Oilfield services company Baker Hughes Inc. says the number of rigs exploring for oil and natural gas in the U.S. declined by six this week to 888. Houston-based Baker Hughes said Friday that 660 rigs were seeking oil and 223 explored for natural gas. Five were listed as miscellaneous. A year ago, 1,861 rigs were active. Among major oil- and gas-producing states, Texas lost six rigs, Wyoming declined by two and Alaska, Arkansas, North Dakota and Pennsylvania each lost one. Kansas gained four rigs, Louisiana increased by three and Oklahoma, Utah and West Virginia each gained one. California, Colorado, New Mexico and Ohio were unchanged. The U.S. rig count peaked at 4,530 in 1981 and bottomed at 488 in 1999.
How Much Longer Can The Oil Age Last? -- History has been so fascinated with oil and its price movements that it is indeed hard to imagine our future without oil. Over the last few months, we have witnessed how oil prices have fluctuated from a 6 year low level of $42.98 per barrel in March 2015 to the current levels of $60 per barrel. It is interesting to note that, in spite of the biggest oil cartel in the world deciding to stick to its high production levels, the oil prices have increased mainly due to falling US crude inventories and strong demand. However, the current upward rally might be short lived and there may yet be another drop in the international oil price when Iran eventually starts pumping its oil into the market at full capacity, potentially creating another supply glut. In these endless price rallies, it is important to take a holistic view of the global energy industry and question which way it is heading. Are the dynamics of global energy changing with current improvements in renewable energy sources and affordable new storage technologies? Can the oil age end in the near future? Will we ever stop feverishly analyzing the rise and fall of oil prices? Or, will oil remain irreplaceable in our life time?
Where Oilfields Are Still Booming - Oilpro: The international rig count is only down about 10% year-over-year while the North America (NAM) rig count is down about 50% over the same period. While the international oilfields tend to be less cyclical than the NAM rig count, the wide difference is due in part to the fact that some country markets outside the US are actually booming right now. Namely the OPEC powerhouses of the Middle East. Baker Hughes released its monthly international drilling stats. The rig count data shows the OPEC leadership's commitment to gaining market share and supplying the markets with their lower cost barrels in spite of depressed oil prices. While traders bidding up oil prices have been focused on the US oil rig count decline, we submit they should also be paying attention to the counter cyclical trend playing out in some oilfields of the Middle East. Saudi Arabia is running more rigs today than ever before and the rig counts in Oman, Algeria, and Kuwait look strong. Outside of the Middle East, Argentina is hitting record high drilling activity levels, and Indonesia's rig count is tracking above year-ago levels. Across most of Europe and Latin America though, the rig count trend is lower. Below is a snapshot of the country markets outside of North America that are booming. The busts are shown as well to provide some context. Notably, while some of the Middle Eastern powerhouses are seeing strength, other countries in the region are seeing their rig counts fall and fall significantly. In the Middle East, not everyone is winning. It's also important to note that booming activity in the Middle East does benefit foreign companies. The big oil service companies work on large contracts in the area, and the majors also partner with country NOCs to exploit these resources
EIA cuts 2015, 2016 U.S. crude oil production growth forecasts -- The U.S. government on Tuesday lowered its 2015 and 2016 crude oil production growth forecasts amid lower prices and fewer active drilling rigs. In its short term energy outlook, the U.S. Energy Information Administration lowered its 2015 crude oil production growth forecast to 530,000 barrels per day (bpd) from 550,000 bpd, while 2016 growth was seen at 20,000 bpd, down from 80,000 bpd previously. Meanwhile, it raised its 2015 U.S. oil demand growth forecast to 340,000 bpd vs 330,000 bpd seen last month and cut its 2016 demand growth forecast to 70,000 bpd from 90,000 bpd previously. Since last June, U.S. producers have reacted quickly to a nearly 60 percent drop in prices by cutting spending, eliminating jobs and idling more than a half of the country’s rigs. Active oil rigs last week declined for the 22nd week in a row, Baker Hughes reported. Still, “while there are fewer rigs drilling for crude, U.S. oil production this year is still on track to be the highest in more than four decades,” EIA Administrator Adam Sieminski said in a statement. The EIA added that U.S. crude oil production averaged some 9.3 million bpd in March, but is expected to decline from June through September before growth resumes. The EIA’s report comes after the Organization of the Petroleum Exporting Countries said that its oil output rose further in April while demand for its oil would be 50,000 bpd higher than previously thought. OPEC cut its forecast for the growth in U.S. oil output this year by 40,000 bpd to 700,000 bpd. It left the estimate for all non-OPEC countries’ supply growth unchanged.
Oil glut worsens as OPEC market-share battle just beginning - IEA – A global oil glut is building as OPEC kingpin Saudi Arabia pumps near record highs in an attempt to win a market-share battle against stubbornly resistant U.S. shale production, the International Energy Agency (IEA) said on Wednesday. The West’s energy watchdog said in a monthly report that although higher-than-expected oil demand was helping to ease the glut, growth in global oil consumption was far from spectacular. As a result, signs are emerging that the crude oil glut is shifting into refined products markets, which could make a recent rally in oil prices unsustainable. “Despite tentatively bullish signals in the United States, and barring any unforeseen disruption elsewhere, the market’s short-term fundamentals still look relatively loose,” said the IEA, which coordinates energy policies of industrial nations. Global oil production exceeds demand by around 2 million barrels per day, or over 2 percent, following spectacular growth in U.S. shale production and OPEC’s decision last year not to curtail output in a bid to force higher-cost U.S. producers to cut theirs. As a result, benchmark Brent oil prices more than halved from June 2014 to $46 per barrel in January. They have since rebounded to around $65, however, on fears of a steep slowdown in U.S. production growth. “In the supposed standoff between OPEC and U.S. light tight oil (LTO), LTO appears to have blinked. Following months of cost cutting and a 60 percent plunge in the U.S. rig count, the relentless rise in U.S. supply seems to be finally abating,” the IEA said.
OPEC Forecasts Oil As Low As $40 For Next Decade -- Whether it is more posturing ahead of OPEC's June meeting is unclear but the message from 'sources', according to The Wall Street Journal is "OPEC won’t agree to go lower," with regard global market share (which has fallen from more than 50-% to just 32% currently). The cartel's latest strategy report forecasts oil prices won't reach $100 - “$100 is not in any of the scenarios,” in the next decade (and could drop below $40) with its most optimistic scenario $76 in 2025 (which only Qatar and Kuwait can cover expenditures with). “If they want to sustain the organization, they have no choice,” but to reintroduce production quotas, adding any concession by stronger members would be temporary. As The Wall Street Journal reports,The Organization of the Petroleum Exporting Countries doesn’t see oil prices consistently trading at $100 barrel again in the next decade, a pessimistic assessment that has the group considering the return of production limits to influence the market, according to a draft of the cartel’s latest strategy report. The report, seen by The Wall Street Journal, predicts that oil prices will be about $76 a barrel in 2025 in its most optimistic scenario, a reflection of OPEC worries that American competitors will be able to cope with low prices and keep pumping out supplies. It also contemplates situations where crude oil costs below $40 a barrel in 2025. “$100 is not in any of the scenarios,” said a delegate at the OPEC strategy presentation last week in Vienna
OPEC expects oil prices to be about $76 a barrel in 2025 - WSJ - The Organization of the Petroleum Exporting Countries (OPEC) expects oil prices to be about $76 a barrel in 2025 in its most optimistic scenario, the Wall Street Journal reported, citing a draft of the cartel’s latest strategy report. OPEC does not expect oil prices to consistently trade at $100 barrel again in the next decade, an assessment that has the group considering the return of production limits, the Journal said.. Oil slipped towards $65 a barrel on Monday as signs that U.S. shale oil production was recovering after a recent price rally renewed concerns of a growing global supply glut. The report also considers situations where crude oil costs below $40 a barrel in 2025, the Journal said. OPEC decided against cutting output in November, despite a huge oversupply in world markets. The report recommends that OPEC return to a production quota system that it abandoned in 2011 after fights over how much each country would get to produce, the Journal said.
Saudi Arabia's April crude output hits record high - Top global oil exporter Saudi Arabia raised its crude production in April to a record high, feeding its flourishing Asian market share and its own power plants and refineries. The world’s top oil exporter pumped 10.308 million barrels of oil per day in April, a Gulf industry source told Reuters on Tuesday, compared to 10.29 million bpd in March. “This is an indication of strong demand, especially from Asia, as well as increasing domestic consumption during summer,” the source said. The increase underlined Saudi Arabia’s determination not to cede market share to higher-cost producers, such as U.S. shale drillers. The kingdom and others in the Organization of Petroleum Exporting Countries (OPEC) had resisted cutting production to shore up oil prices. It also highlights the strength of global demand, which has helped lift refinery profit margins to their highest in years. Oil Minister Ali al-Naimi has said the kingdom’s output would likely remain around 10 million bpd, and that he was “very positive” about Asian oil demand outlook.
Saudi claims oil price strategy success - FT.com: Saudi Arabia says its strategy of squeezing high-cost rivals such as US shale producers is succeeding, as the world’s largest crude exporter seeks to reassert itself as the dominant force in the global oil market. The kingdom’s production rose to a record high of 10.3m barrels a day in April and there is no sign that it plans to reverse its policy at next month’s meeting of Opec, the producers’ cartel, in Vienna. “There is no doubt about it, the price fall of the last several months has deterred investors away from expensive oil including US shale, deep offshore and heavy oils,” a Saudi official told the Financial Times in Riyadh, giving a rare insight into the kingdom’s thinking on oil strategy. The International Energy Agency, the world’s leading energy forecaster, on Wednesday released data backing up the Saudi position. The agency said that with the number of rigs running in the US plunging by 60 per cent in response to lower oil prices, US shale oil production had “buckled” in April, “bringing a multiyear winning streak to an apparent close”. But the IEA also cautioned that it would be “premature” to suggest that Opec had “won the battle for market share”. It said global crude supply was growing, even from high-cost areas such as Brazil, as well as from other Opec member states such as Iran and Iraq. However, the Saudi official said he expected the kingdom to maintain its dominance of global energy, despite the growth of alternatives to fossil fuels and competition from rival oil producers within Opec and beyond. “Saudi Arabia wants to extend the age of oil,” he said. “We want oil to continue to be used as a major source of energy and we want to be the major producer of that energy.”
How Saudi Arabia Sets The Global (Currency) Markets -- Most investors believe that the U.S. dollar is the primary influence upon commodity prices. While there certainly is a strong correlation between the dollar and commodities, we would argue that the real dynamics in the market work slightly differently. Example: Oil has the potential to set the dollar price, which in turn puts pressure on the broader commodity complex. Has the world turned upside down? Please bear with us as we explain our view. There is an almost perfect negative correlation between crude oil and the U.S. dollar. Consequently, crude oil has a strong positive correlation with the euro. The next two charts show those relationships. Examine the oil/currency correlation. Crude oil is one of the largest markets with an annual value of $1.7 trillion so its moves strongly influence other markets. As the price of crude oil drops, there are fewer dollars in circulation. Consequently, the dollar price rises, and the euro falls. Moreover, it appears that oil exporting countries (think Saudi Arabia or Iran) trade oil in dollars but they invest part of their reserves in euros, according to Robert Gabriel Luta. When the oil price falls, their revenues decline, and they transfer fewer reserves from dollars into euros.Recently, Saudi Oil Minister Ali Al-Naimi said, “no one can set the price of oil – it’s up to Allah.” (source: Zerohedge)One of the most influential individuals in the oil market worldwide probably knows better. What is really occurring?The next chart says it all. The global oil supply and demand picture shows that OPEC increased oil production last September for the first time in more than 1.5 years, as marked with the green circle. Until that time OPEC was consistently reducing their oil production 0.5 to 1 million barrels per day.
U.N. rep accuses Saudis of violating international law - A Saudi-led coalition rained down missiles in Yemen from Friday into Saturday, an intense attack that a U.N. official called a breach of international humanitarian law. The Saudis admitted that the latest attack against Houthi rebels in Yemen -- 130 airstrikes in a 24-hour period -- included the targeting of schools and hospitals. The hospitals and schools that were hit functioned as weapons storage sites, coalition spokesman Brig. Gen. Ahmed Asiri said in a statement. The operations were "targeting headquarters of the Houthi leaders," Asiri said. Civilians had been warned ahead of time to leave the cities of Sadaa, Maran, Albiqaa and the border area between Saudi Arabia and Yemen, Asiri said. In addition, the coalition spokesman accused the Houthi rebels of manning checkpoints that prevented civilians from leaving, in effect using them as human shields. That rationalization for Friday and Saturday airstrikes was rejected by Johannes Van Der Klaauw, the U.N. humanitarian coordinator for Yemen.
Saudi Arabia Says King Won’t Attend Meetings in U.S. - — Saudi Arabia announced on Sunday that its new monarch, King Salman, would not be attending meetings at the White House with President Obama or a summit gathering at Camp David this week, in an apparent signal of its continued displeasure with the administration over United States relations with Iran, its rising regional adversary.As recently as Friday, the White House said that King Salman would be coming to “resume consultations on a wide range of regional and bilateral issues,” according to Eric Schultz, a White House spokesman.But on Sunday, the state-run Saudi Press Agency said that the king would instead send Crown Prince Mohammed bin Nayef, the Saudi interior minister, and Deputy Crown Prince Mohammed bin Salman, the defense minister. The agency said the summit meeting would overlap with a five-day cease-fire in Yemen that is scheduled to start on Tuesday to allow for the delivery of humanitarian aid. Arab officials said they viewed the king’s failure to attend the meeting as a sign of disappointment with what the White House was willing to offer at the summit meeting as reassurance that the United States would back its Arab allies against a rising Iran.
Saudi Arabia Promises to Match Iran in Nuclear Capability - When President Obama began making the case for a deal with Iran that would delay its ability to assemble an atomic weapon, his first argument was that a nuclear-armed Iran would set off a “free-for-all” of proliferation in the Arab world. “It is almost certain that other players in the region would feel it necessary to get their own nuclear weapons,” he said in 2012.Now, as he gathered Arab leaders over dinner at the White House on Wednesday and prepared to meet with them at Camp David on Thursday, he faced a perverse consequence: Saudi Arabia and many of the smaller Arab states are now vowing to match whatever nuclear enrichment capability Iran is permitted to retain. “We can’t sit back and be nowhere as Iran is allowed to retain much of its capability and amass its research,” one of the Arab leaders preparing to meet Mr. Obama said on Monday, declining to be named until he made his case directly to the president. Prince Turki bin Faisal, the 70-year-old former Saudi intelligence chief, has been touring the world with the same message.
China Has Become the World’s Biggest Crude Oil Importer for the First Time - China is now the largest importer of crude oil in the world. In April, it surpassedthe U.S., which has traditionally held the slot, with imports of 7.4 million barrels per day (bpd) or 200,000 more than the U.S., according to the Financial Times. The news comes as a surprise because the Chinese economy has been slowing and just this weekend, in an effort to stimulate growth, the People’s Bank of China cut interest rates for the third time in 6 months. Over the next few months, the U.S. and China may be in and out of the top spot, but because American imports dropped by about 3 million bpd in the last decade (thanks in large part to shale extractions) and because China’s purchases have boosted seven-fold, the Chinese should be the top crude oil importer on a long term basis. China overtook the United States as the world’s top energy consumer in 2010 and is already the number one purchaser of many commodities, such as coal, iron ore and most metals.
China Could Hold Oil Market To Ransom, Tops US As World's Largest Importer -- For the first time in history, China overtook the US as the world’s biggest importer of crude oil in April, as The FT reports, representing the culmination of a seismic shift in global energy flows over the past decade. The jump in China imports last month was partly down to higher shipments from Iran, who "may be offering more discounts on its oil as part of an effort to increase ties with Chinese oil companies," according to consultancy Energy Aspects. "Iran is keen to secure more Chinese investment." But as OilPrice.com's Jim Hinton warns this shift means that China could hold the oil markets to ransom... And that means that oil futures are tied intimately in with China and the future of the South China Sea. As The FT reports, while China’s imports are not expected to consistently surpass those of the US until the second half of this year, the move illustrates how the US shale revolution has cut the country’s reliance on oil from overseas — and how China’s demand has grown even as its economy slows. China’s imports increased as it stockpiled oil. “It’s begun,” Mr Fenton said. “China’s crude imports have been above trend in four of the past five months.”… But the long-term trend is in China’s favour. The country is adding more refining capacity with its economy still growing at more than 7 per cent a year. In 2013 China overtook the US in combined imports of crude and refined oil products like gasoline and diesel.
China’s Mad Dash for the South China Sea -- No more hiding its claws, no more biding its time, China has unquestionably entered a new era of assertiveness, casting aside Deng Xiaoping’s decades-long call for moderation, humility, and calculation in foreign policy. China is slowly but surely moving from consolidating its claims on features it has been occupying for decades to dominating the entire South China Sea, gradually achieving the capability to fully drive out Southeast Asian claimant states from other features under their control. Quite naturally, a sense of panic has gripped neighboring countries such as the Philippines, which have been locked in a bitter and seemingly hopeless maritime spat with their giant neighbor. We are no longer just talking about hypotheticals here; China is unabashedly operationalizing its sweeping claims across adjacent waters. Far from resorting to its frequent tactic of pure obfuscation, the China’s Ministry of Foreign Affairs (MFA)—supposedly, the “voice of moderation” in China’s state apparatus—has become increasingly forthright and lucid in its defense of China’s assertive behavior in adjacent waters. After months of constant denial, China’s feisty Foreign Ministry Spokeswoman Hua Chunying has boldly declared: “China is entitled to set up ADIZs [Air Defense Identification Zone]” in adjacent waters, and a “decision in this regard depends on whether the air safety is threatened and to what extent it is threatened.”
Chinese Iron Ore Prices Plunge After CISA Warns Of Persistent Overcapacity -- Having rebounded along with practically every other risk-asset class in the world over the last month or so, Chinese Iron Ore futures are collapsing tonight. Despite the promise of Chinese LTROs expanding credit (just like they didn't in Europe), iron ore prices are down around 4% - the biggest drop in over 2 years - to as low as CNY419 (or around $62) as China Iron & Steel Association warns that overcapacity in the seaborne iron ore market will persist through to at least 2019 as the world’s largest suppliers expand production further. Iron Ore prices are down the most in over 2 years...“Low-cost seaborne supply entering the market is not only displacing high-cost Chinese production, but also high-cost seaborne supply,” Alan Chirgwin, BHP iron ore marketing vice president, told the conference. Supply will rise by about 100 million to 110 million tons this year, exceeding modest demand growth of about 30 million to 40 million tons, he said. Major producers remain intent on expansions and a battle for market share is under way as miners attempt to reduce their costs faster than prices are dropping,according to Credit Suisse Group AG.
China's Annual Steel Consumption Drops for First Time in Three Decades - China's apparent crude steel consumption fell for the first time in three decades in 2014, data from an industry association showed, a further indication of how the country's economic slowdown is hurting industrial demand. A decline in the use of steel in China, which is both the top consumer and producer of the alloy, will dent iron ore prices that have already been roiled by a global oversupply. Spot rates of the steelmaking ingredient are currently mired near a 5-1/2 year low $65.60 per tonne. China's apparent crude steel consumption fell 3.4 percent from a year ago to 738.3 million tonnes in 2014, according to calculations published by the China Iron and Steel Association (CISA) on Thursday. Official data shows China's power output growth fell to a 16-year low last year, while coal output likely dropped for the first time in more than a decade. China's 2014 steel output rose 0.9 percent to a record 822.7 million tonnes over the year, data showed. "Affected by overcapacity, it is unlikely there will be any turnaround in oversupply in the steel product market or any big recovery in prices," CISA said
China Cuts Interest Rates as Economic Growth Slows - WSJ: China cut interest rates for the third time in six months amid a worse-than-expected economic slowdown, as authorities scramble to ease the heavy debt burdens of companies and governments. The People’s Bank of China said Sunday it would shave a quarter of a percentage point off benchmark lending and deposit rates, effective Monday. The move comes as senior Chinese officials are growing more fearful that the mountain of debt from the rapid expansion of credit over the past few years is weighing on efforts to pick up the world’s second-largest economy. In one of the starkest official warnings about China’s growing debt woes, the PBOC said in its monetary-policy report Friday that the “rising debt size is forcing China to use a lot of resources in repaying and rolling over debt” while limiting the room for further fiscal expansion. The central bank is also considering a credit-easing tool that will allow local governments to restructure debts, according to people familiar with the matter. Meanwhile, easing measures taken by the central bank—including two interest-rate reductions since November—have largely failed to spur new-loan demand. Instead, the actions have triggered a strong run-up in China’s stock markets in recent months, which has helped the authorities to keep funds from flowing outside China but also led to concerns over speculative trading. Chinese shares tumbled last week as regulators moved to limit investors’ ability to buy stocks with borrowed funds.
China Cuts Rates to Halt a Slide in Its Economy - — Hoping to shore up a weakening economy, China said on Sunday that it would cut benchmark interest rates for the third time in five months.The nation’s central bank said in its announcement that the one-year lending rate would be reduced by 25 basis points, or a quarter of a percentage point, to 5.1 percent, and that the one-year deposit rate was also being cut 25 basis points, to 2.25 percent.The government announced weaker-than-expected trade figures on Friday, with exports dropping 6.4 percent in April compared with a year earlier, and with persistent signs of weakness in other parts of the economy. On Saturday, the government reported tepid consumer inflation, which ran at a rate of 1.5 percent in April.By reducing interest rates, the government hopes to spur lending to businesses and create more momentum for the economy, the world’s second-largest after the United States. Although China is still growing faster than any other major economy, the slowdown has worsened in recent months.China reported last month, for instance, that its economy grew just 7 percent in the first quarter of this year, one of the lowest rates in a decade and far below the double-digit growth the country had become accustomed to over the past few decades.This year, the government has targeted growth of about 7 percent, but policy makers are concerned that the pace is falling too rapidly and that growth much lower than 7 percent could create huge disruptions in the economy.
China rate cuts aim to hold line against deflation - FT.com: China’s third interest-rate cut in six months signalled the central bank’s commitment to pushing back against deflation and its impact on real borrowing costs. But what is less clear to analysts is the extent to which lower rates — and a host of other easing measures — can solve the conundrum that has bedevilled many a central bank: how to ensure that looser monetary policy translates into a greater flow of funds into the real economy. The Communist party’s politburo noted in an April 30 meeting that while money-market interest rates have fallen since the latest cut in banks’ reserve requirement rations in mid-April, this increased liquidity has largely not filtered through to the real economy. Economists, noting that rate cuts alone do little to address this concern, expect to see further easing in the form of targeted measures to channel credit to desired sectors of the economy. The People’s Bank of China granted Rmb132bn in “pledged supplementary lending” to China Development Bank, the largest of the country’s non-commercial “policy banks” in the first quarter, following Rmb383bn in such lending in 2014. These loans are earmarked for infrastructure and slum redevelopment. “Compared to PSL, cutting the benchmark interest rate is symbolically more significant, but the PSLs and other forms of securitisation through capital markets probably have a higher impact on the real economy,” said Weishen Deng, China economist at Credit Suisse.
Economists React: China’s Rate Cut Is a Stone Aimed at Many Birds - China has announced its third interest rate cut in six months, saying it would cut benchmark lending and deposit rates by a quarter of a percentage, to 5.1% and 2.25% respectively, effective Monday. The decision was accompanied by another push to liberalize deposit rates. While the exact timing of the move may have caught some off-guard, the cut was widely expected amid slowing economic growth, mild inflation and wavering sentiment in the domestic stock market.The decision also comes as the government tries to relieve mounting local government debt repayment pressure via a debt restructuring program that has faced headwinds, with banks not excited by bond rates offered by local governments. Less than a month before its most recent move, the central bank also slashed the reserve requirement ratio–the portion of deposits that banks need to keep on reserve with the central bank by a full percentage point. Meanwhile the benchmark Shanghai Composite Index lost 5.3% last week, its worst performance since May 2010. The recent pullback of the stock market provides a good window for the rate cut, ANZ economists said on Saturday. Economists generally expect more policy easing measures to come, with some saying full interest-rate liberalization is possible this year. Below are their remarks, edited for length and clarity:
China's falling interest rates - Expectations are building up that China's central bank will soon announce more easing actions. But it's not what the PBoC is saying that matters to the economy as much as what's actually going on in the short-term rates markets. And short-term rates continue to fall. This is a form of easing without the central bank announcements. Here is the 7-day repo rate - a fairly liquid short-term secured lending market in China. Note that even the 1-year SHIBOR, to the extent it represents an actual lending rate, is falling (though remains elevated relative to inflation). China's rates continue to decline and the PBoC will support this trend - with or without policy announcements. On a related note, one of the reasons China needs to lower interest rates is to help the nation's strapped municipalities refinance their debt. Currently a great deal of the debt is structured using off balance sheet bank products and Beijing's goal is to shift to the muni market. That process however will take some time.
China’s Factory Output, Investment and Retail Sales Miss Forecasts - — China's money supply grew at its slowest pace on record and investment growth sank to its lowest in nearly 15 years as April data showed the world's second-largest economy was still losing momentum despite a concentrated burst of policy easing.Wednesday's data added to concerns that Beijing's growth target of around 7 percent for the year is already at risk, and reinforced views that authorities need to take bolder measures to head off job losses and debt defaults by local governments and companies.The central bank is expected to follow this week's interest rate cut with more stimulus in coming months, while the government may ramp up spending to try to energise the economy, which looks set for its worst year in 25 years."It's again worse than what most people had expected, especially on the investment side. All of this suggests that the downward pressures on growth in China are persisting, especially in the industrial part of the economy," said Louis Kuijs, China economist at Royal Bank of Scotland in Hong Kong."This type of data will motivate policymakers to further ease on the monetary and fiscal sides."The People's Bank of China (PBOC) has cut benchmark interest rates three times in the past six months, including a move early this week, on top of reductions in banks' reserve requirement ratio (RRR) and measures to shore up the ailing property market, which accounts for about 15 percent of the economy.
China economy loses more steam in April, further stimulus on the cards - China's money supply grew at its slowest pace on record and investment growth sank to its lowest in nearly 15 years as April data showed the world's second-largest economy was still losing momentum despite a concentrated burst of policy easing. Wednesday's data added to concerns that Beijing's growth target of around 7 percent for the year is already at risk, and reinforced views that authorities need to take bolder measures to head off job losses and debt defaults by local governments and companies. The central bank is expected to follow this week's interest rate cut with more stimulus in coming months, while the government may ramp up spending to try to energize the economy, which looks set for its worst year in 25 years. "It's again worse than what most people had expected, especially on the investment side. All of this suggests that the downward pressures on growth in China are persisting, especially in the industrial part of the economy," "This type of data will motivate policymakers to further ease on the monetary and fiscal sides." The People's Bank of China (PBOC) has cut benchmark interest rates three times in the past six months, including a move early this week, on top of reductions in banks' reserve requirement ratio (RRR) and measures to shore up the ailing property market, which accounts for about 15 percent of the economy.
China stimulus aims at restructuring trillions in local-government debt - —China is launching a broad stimulus to help local governments restructure trillions of dollars in debts while prodding banks to lend more, as fresh data add to signs of a worsening slowdown in the world’s second-largest economy. In a directive marked “extra urgent,” China’s Finance Ministry, central bank and top banking regulator laid out a package of measures to jump-start one of the government’s most-important economic-rescue initiatives: a debt-for-bond swap program aimed at giving provinces and cities some breathing room in repaying debts. Central to the directive, which was issued earlier this week to governments across the country and reviewed by The Wall Street Journal, is a plan by the People’s Bank of China that will let commercial banks use local-government bailout bonds they purchase as collateral for low-cost loans from the central bank. The goal is to provide Chinese banks with more funds to make new loans. In response to the new directive, the prosperous eastern province of Jiangsu this week relaunched a sale of bonds that package the debt of its local governments but that it delayed last month because banks hesitated to buy them.
China orders banks to keep lending to insolvent state projects - FT.com: China has ordered its banks to prop up insolvent provincial government projects, in the latest effort to support rapidly cooling growth and put off dealing with the mountain of debt that has built up in the past six years. Authorities told financial institutions to keep lending to local government projects even if the borrowers are unable to make principal or interest payments on existing loans. The directive, issued jointly by the finance ministry, banking regulator and central bank, highlights the challenges facing China as it struggles to deal with the massive volume of debt left in the wake of its post-crisis stimulus, amid a sharply slowing economy. The “suggestions on properly handling the issue of follow-up financing for existing projects undertaken by local government financing vehicles” was published on Friday by China’s cabinet, the State Council. It explicitly banned financial institutions from cutting off or delaying funding to any local government project started before the end of last year and said any projects that are unable to repay existing loans should have their debt renegotiated and extended. Analysts said the move amounted to an official policy of “extending and pretending” that an estimated Rmb22tn ($3.54tn) of questionable local government debt would eventually all be repaid.
Ghost Cities of China by Wade Shepard review – unpopulated replica towns explained - Many western observers, on coming across these places, have described them as surreal, or like stage sets – Shepard cites various reports, from Al‑Jazeera to internet “10 Crazy Things About China” webpages. They often conclude that China’s property boom is fake, made up in large part of Potemkin cities set up as property boondoggles. As this book makes clear, that is not quite the case. Shepard has written an account of the economic rationale behind the more apparently strange and freakish aspects of the country’s urbanisation; a crash course in how Chinese capitalism, if that’s what it is, actually works. The first thing to understand is that nobody in China actually owns property. Land is still nationalised, and leases are sold for up to as many as 70 years. That China lacks property, however, doesn’t signify a shortage of property developers. In fact, the “property” market described here sounds as extreme, if not more so, than that of London, with extortionate rents, a paucity of social housing (a pitiful 3% of all construction) and, most of all, the use of apartments and houses as investments – it is normal for middleclass Chinese to borrow their way into owning several unoccupied flats, even if they don’t have one to live in. A version of this practice is now familiar in the UK; who influenced who is an open question. The second important point is that a “city” in China is not simply an urban built-up area. Rather, it is a legal designation referring to everything that the municipality controls. So a “city” such as Chongqing encompasses 28 million people, of whom only around 4.5 million actually live in the recognisable city itself. Urbanisation is much more lucrative than conserving agricultural land, so the municipalities – perpetually starved of central government funds, as in the UK or US – are eager to build.
China Lashes Out Over U.S. Plan on South China Sea - WSJ: Beijing strongly condemned on Wednesday a proposed U.S. military plan to send aircraft and Navy ships near disputed South China Sea islands to contest Chinese territorial claims over the area. “We are severely concerned about relevant remarks made by the American side. We believe the American side needs to make clarification on that,” said Foreign Ministry spokeswoman Hua Chunying.The unusually strong comments came after U.S. officials said Defense Secretary Ash Carter had asked his staff to look at options to counter China’s increasingly assertive claims over disputed islets in the South China Sea. Those options, officials said, include flying Navy surveillance aircraft over islands and sending U.S. Navy ships within 12 nautical miles of reefs that have been built up in recent months around the Spratly Islands. “We always uphold the freedom of navigation in the South China Sea,” Ms. Hua said. “But the freedom of navigation definitely does not mean the military vessel or aircraft of a foreign country can willfully enter the territorial waters or airspace of another country. The Chinese side firmly upholds national sovereignty and security.” Ms. Hua said Beijing urged “relevant countries to refrain from taking risky and provocative action.”
China warns US not to send warships to disputed South China Sea waters - Beijing yesterday said it was "extremely concerned" that the Pentagon might send military ships and aircraft to disputed waters in the South China Sea. Observers said that if Washington did make such a move, it could become a new flashpoint in the already volatile Sino-US relationship and overshadow talks between US Secretary of State John Kerry and Chinese officials this weekend. China would definitely safeguard its territorial sovereignty. We demand 'the relevant side' talks and acts cautiously to maintain regional peace and stability and does not take any provocative action," foreign ministry spokeswoman Hua Chunying said. "Freedom of navigation certainly does not mean that foreign military ships and aircraft can enter another country's territorial waters or airspace at will." Hua's comments came after reports that US Defence Secretary Ash Carter had requested options to "assert freedom of navigation" by sending aircraft and warships within 12 nautical miles of Chinese-made artificial islands in the Spratly chain.
U.S. Gambit Risks Conflict With China - WSJ: —After repeated and unheeded warnings to China to halt its massive reclamation works in the South China Sea, the U.S. is contemplating an option fraught with danger: limited, but direct, military action. By sending U.S. warplanes over artificial islands that China is building, and sailing naval vessels close by—an option now under consideration, according to U.S. officials in Washington—America could end up being sucked more deeply into an increasingly heated territorial dispute between China and its neighbors, say regional security experts. If such action fails to deter China, America will face a hard choice: back down and damage its credibility with friends and allies in the region, or escalate with the risk of being drawn into open conflict with China. China immediately suggested that America would be crossing a line if it goes ahead with the plan. “Do you think we would support that move?” asked Foreign Ministry spokeswoman Hua Chunying. “Freedom of navigation definitely does not mean the military vessel or aircraft of a foreign country can willfully enter the territorial waters or airspace of another country.” Her comments reinforced a view that America and China may be on a collision course. There’s very little prospect that China will stop ballooning the specks of territory it controls in the Spratly Islands. Much of the work has already been completed, but there is still more to do.
It’s all fun and games until war breaks out - Lately, there has been much discussion about whether or not Japan should rewrite its Constitution, which renounces war-making capabilities, and become a “normal country” with a full-fledged military that can do all the things other normal countries’ militaries do, like go abroad and kill in the name of whatever cause it deems important. The discussion has avoided hard specifics. It has even avoided essential vocabulary. Several weeks ago, Prime Minister Shinzo Abe was forced to backpedal when he called Japan’s Self-Defense Forces (SDF) “our military,” and later opposition lawmaker Mizuho Fukushima was asked by the ruling party to retract a comment she made in the Diet about the government’s national security bills, because she called them “war legislation.” How can you debate such proposals if you have to tiptoe around their meaning?When U.S. Sen. John McCain mentioned last week that Japan will be expected to fight alongside its allies overseas after these changes are made, the Japanese press barely covered it. Since it isn’t OK for Japanese politicians to talk about the subject in such blunt terms, reporters may have been stumped for a way to address McCain’s remarks. The media use arcane words and convoluted syntax to avoid saying the obvious when they talk about the security bills. As a result the average person has a vague idea of what’s at stake. In a rare, far-ranging interview that appeared in the April 21 Asahi Shimbun, a former Ground Self-Defense Force (GSDF) officer, Naoto Hayashi, expressed dismay at the Japanese public’s poor understanding of the SDF’s role, a situation created by the press, “including Asahi Shimbun,” he said. He derided the notion that the SDF could be used to rescue Japanese nationals kidnapped in a foreign land, a suggestion by Abe to gain support for the bills, and implied that since voters thought such a mission might be a good fit for the SDF, it only proves the public knows nothing about the SDF.
No need for haste on TPP deal - The Japan Times --The 12 countries taking part in the negotiations for the Trans-Pacific Partnership (TPP) free trade agreement will hold ministerial-level talks in late May in the Philippines, following talks among their chief negotiators in Guam. As the countries step up their efforts to reach a broad agreement on major issues at the ministerial meeting, Japan and the United States, the two biggest economies among the participants, are hoping to round up their TPP-related bilateral negotiations. Some argue that since China’s initiative to create the new Asian Infrastructure Investment Bank is gaining momentum, attracting not only Asian economies but also major European powers as founding members, serious efforts should be made to wrap up the TPP talks now to establish a framework of economic cooperation in the Asia-Pacific region led by the U.S. and Japan to counter China’s rising clout. The Abe administration should not be swayed by such an argument and ought to refrain from making hasty moves in the TPP talks, keeping in mind that once the TPP takes effect, it’s going to have a deep and wide-ranging impact on Japan’s economic and social structure. The government needs to set aside political considerations and make cool-headed calculations concerning the long-term merits and demerits of the free trade pact. It should never make easy compromises that potentially damage Japan’s interests while bringing few gains.
More than 1,000 plaintiffs file lawsuit to keep Japan out of TPP - More than 1,000 people filed a lawsuit against the government on Friday, seeking to halt Japan’s involvement in 12-country talks on a Pacific Rim free trade agreement, which they called “unconstitutional.” A total of 1,063 plaintiffs, including lawmakers, claimed in the case brought to the Tokyo District Court that the proposed Trans-Pacific Partnership would undermine their basic human rights under the Constitution. The lawsuit is led by Masahiko Yamada, 73, a lawyer who served as agriculture minister in 2010 as part of the Democratic Party of Japan government. “The TPP could violate the Japanese right to get stable food supply, or the right to live, guaranteed by Article 25 of the nation’s Constitution,” Yamada, who abandoned his party in 2012 over then-Prime Minister Yoshihiko Noda’s push to join the TPP talks, said Thursday before the court filing. The envisaged pact would benefit big corporations but would jeopardize the country’s food safety and medical systems, and destroy the domestic farm sector, according to the plaintiffs.
Worried About Currency Manipulation? Worry About the WTO - Anti-free trade activists are doing their best to expand negotiations over the Trans-Pacific Partnership to include concerns about so-called currency manipulation. But a provision in a separate customs enforcement bill would do the trick, say experts on both sides of the trade fight. The provision, pushed by Democratic Sen. Charles Schumer of New York, Republican Sen. Rob Portman of Ohio—a former U.S. trade representative, no less—and others would make a seemingly simple change in U.S. trade law. It would include currency undervaluation as an unfair subsidy under U.S. trade law, which applies to all nations, not just the 12 in the TPP. For example, should the Commerce Department decide that China–not a member of the TPP deal—had kept its currency undervalued as a way to help Chinese steel makers, then under the proposed law, Commerce could use that finding to whack China with tariffs. Simple and enforceable. “Currency manipulation could now be considered a factor, but to have a successful case an industry would still need to show injury,” Scott Paul, president of the Alliance for American Manufacturing, an organization of steel makers and the United Steelworkers, said in an email. “And yes, it would apply to ALL trading partners.” Mr. Paul’s use of the word “injury,” refers to a provision in all subsidy and dumping cases that the International Trade Commission, a U.S. agency, must determine that an industry is “injured” by the unfair trade practices.But such a case wouldn’t end there. China–or whoever was hit with a U.S. subsidy tariff—would be sure to challenge the judgment at the World Trade Organization. It’s far from clear how the WTO would rule.
Currency war poses dilemma for BOK: Major economies in the Asia-Pacific region are engaging in close competition to lower their currency values, which could aggravate the slowdown of Korea’s exports and put more pressure on local policymakers to consider an additional rate cut, according to analysts. Many investment banks at home and abroad predict Korea will keep its rate untouched at the current level of 1.75 percent per annum during the Bank of Korea’s Monetary Policy Committee meeting, slated for Friday. Analysts say could be risky for the central bank to cut the rate again amid the growing possibility of a rate hike by the U.S. Federal Bank later this year and the seriousness of household debt in Korea. However, recent monetary polices in the region are posing a dilemma for the BOK. Some analysts have noted that several countries in the region ― China, India, Vietnam, Thailand and Australia ― are already engaging in currency wars via arbitrary depreciation. In particular, China slashed its benchmark lending rate again by 25 basis points to 5.1 percent on Sunday, following the previous cuts last November and March. Thailand and Australia cut their benchmark rate by 25 basis points, to 1.5 percent in late April and 2 percent in early May, respectively.
Korea’s growing debt woes extend to students -- The number of Korean students struggling to pay back student loans surged nearly 117 percent between 2010 and 2014, said a report by the Korea Institute of Finance (KIF) on Monday. Defaults are rising too. The report is particularly bad news considering that many young, college-educated Koreans are having difficulty finding good jobs or any jobs at all during a longer-than-expected economic slowdown. The outstanding balance of student loans stood at 10.7 trillion won ($9.78 billion) as of last year, up from 8.8 trillion won in 2013, while the number of student debtors hit 1.52 million, up from 1.36 million a year earlier, according to data compiled by Korea Higher Education Research Institute. From 2010, when the government-run student loan program was launched, the number of loans issued jumped 117 percent. As of late 2013, there were 41,000 college students who defaulted on loan payments for more than six months, up from 26,000 in 2010. The total number of defaulting students came to 44,620 as of December, accounting for about 17 percent of total borrowers with college diplomas, including those who took normal bank loans. “Korea’s student loan policy is too generous,” said Kang Jong-man, report author and a KIF researcher. “Although the loan system was introduced five years ago, loan issuances spiked and the number of those with dangerous credit problems is rapidly becoming a social problem.”
How Social Security Could Boost India’s Economy - This weekend, India’s Prime Minister Narendra Modi launched three social securityschemes aimed at helping the people of West Bengal gain access to pensions and insurance. Earlier, Modi also launched a program to provide every Indian citizen with a bank account in a bid to promote financial management, especially amongst the poor, and to modernize payment methods for workers. Social security, though not novel, is still an underdeveloped concept for a country where at least 30% of the population continues to live in poverty and where old age is often accompanied by extreme destitution for many. The current program covers only a small portion of the population and is primarily employer driven, limiting its scope to help the vast majority of people.While Modi’s plans to create a bigger safety net for more citizens are still in their infancy, they could be a harbinger of an important change for the Indian workforce, one that can enhance the skill level of labor, enable entrepreneurship, increase consumption, and propel Indian commerce to new heights. The concept, of course, has a successful precedent in the U.S. and arguably changed the course of American history by freeing Americans to aim for higher education, innovate, and take entrepreneurial risk instead of worrying about their welfare when they grew old. That spirit of risk-taking has been instrumental in creating America’s technology boom and boosting its economic power over the decades.The same could happen in India if Modi succeeds in widening the scope of the nation’s social security program. It might even be crucial.
Is Modi's Honeymoon Over? -- Things are not looking so rosy at home for Indian Prime Minister Narendra Modi as he continues his world tour with the latest stop in Beijing, China.Is Modi government's honeymoon already over on its first anniversary at the helm? Has the Indian economy really turned around? Is it really growing faster than China? Are Indian businesses doing better under the new government? Are investors more excited about India's prospects? Has Indian currency recovered to levels before its collapse in 2013? Is India any cleaner than it was last year? To answer these questions, let's look at some data:
1. Revision of GDP methodology by India's Central Statistical Office (CSO) to show it is growing faster than China has drawn serious skepticism, even derision by serious economists around the world.
2. India's exports are continuing to drop. The trade data shows a sharper slowdown (21%) in exports than in imports (13%, due to lower oil prices) for the last reported month (March 2015). There is an overall decline in both for the year too, according to Seeking Alpha.
3. Large scale manufacturing in India continues to disappoint. Growth slowed in April 2015, according to HSBC India Manufacturing Purchasing Managers Index (PMI) data. At 51.3 in April, down from 52.1 in March, the headline PMI points to slowing demand.
4. Mumbai stocks are among the worst performing in emerging markets.
5. In spite of Prime Minister Modi's high-profile campaign to improve hygiene, India has been ranked near the bottom on access to clean water and sanitation. India has ranked 92 on Water, Sanitation and Hygiene (WASH) Index developed by The Water Institute at the University of North Carolina at Chapel Hill's Gillings School of Global Public Health in the US, far below Pakistan which ranked near the top in 5th position.
India & China seal record 24 deals estimated at $10bn — India and China have signed a record 24 bilateral agreements worth $10 billion during Indian Prime Minister Narendra Modi’s first visit to China. Both sides are dedicated to establish a “new direction between the two largest Asian countries.” Education, establishment of consulates, space exploration, mineral resources, railway systems and TV were among 24 intergovernmental agreements signed by India and China in Beijing. The news was announced after Modi held negotiations with Chinese Premier Li Keqiang on Friday. The meeting took place in Beijing on the second day of the PM’s three-day visit to China. "Today, we have signed over 20 agreements, covering diverse areas of cooperation. This shows the depth and maturity of our relationship and the positive direction of our partnership," said Narendra Modi in a joint press conference after the signing of the deals. Mr. Modi also said India wanted more investment from China, greater access to its markets and a shared commitment to ensure that their disagreements remain in check. “We are committed to set a new direction between the two largest Asian countries,” he said. “This is one of our most important strategic partnerships.”
India’s Wholesale Prices Fall for Sixth Consecutive Month - WSJ: India’s wholesale price index fell for the sixth month in a row in April thanks to lower oil prices. The index fell a sharper-than-expected 2.65% from a year earlier, after declining 2.33% in March, government data showed Thursday. Economists surveyed by The Wall Street Journal had forecast that the WPI WPI -7.14 % would slip 2.20%. Fuel prices in April fell 13.03% from a year earlier while prices of manufactured products, which make up about 65% of the index, declined 0.52%. Food prices rose 5.73% year-over-year last month, down from a 6.31% rise in March. India’s wholesale price inflation rate was 6% a year ago but has come down sharply due to the decline since then in international prices of commodities, particularly crude oil, has helped the South Asian economy swing to deflation. Although global prices of oil, which is India’s biggest import by value, have risen in recent months, they are still much lower than last year. Economists say the deflation in India’s wholesale prices is likely to continue at least until June. Government data issued Tuesday showed the consumer inflation rate, which is the most closely watched measure of price rises in the country, fell to 4.87% year-over-year in April from 5.25% in March.
Slow growth, bad debt will force India banks to cut rates - CRISIL (Reuters) - Stressed borrowers and slow credit growth will force India's commercial banks to yield to pressure from the central bank and do more to pass on lower policy rates, analysts at domestic ratings agency CRISIL said on Tuesday. The Reserve Bank of India has cut the repo rate by 50 basis points in two moves since January, to 7.5 percent. But so far, citing the high cost of funds, Indian banks have only trimmed their own lending rates, with the country's largest bank, State Bank of India , cutting just 15 basis points. "There is limited ability (in banks) to hold on," Rajat Bahl, director at CRISIL Ratings, said during a teleconference on the outlook for India's banking sector. "Given that borrowers are also (under) stress, to see growth and to see the borrowers remaining stable, they will have to pass on the benefits of the (lower) interest rates." India's banks have struggled under the weight of bad loans, and Bahl said lower lending rates could help tackle that, as fewer borrowers would end up in trouble. CRISIL expects total stressed assets, which include non-performing loans and those that could turn bad, to rise to 5.3 trillion rupees (53 billion pounds) by March 2016, from 4.7 trillion in the previous year.
In Asia, Debt Market Gets Tougher - WSJ: As banks scaled back lending during the financial crisis, the bond market bloomed in Asia. Now, as global interest rates begin to rise, the days of easy financing appear to be over. With growth slowing in Asia, bond investors have become more demanding, seeking higher interest rates and better terms for the debt. With the exception of a modest selloff in Japanese government debt, Asia has sidestepped the bond selloff in Europe and U.S. But higher rates in the U.S. could hurt Asia’s sluggish growth and would run counter to efforts by central banks from Australia to China to Thailand to cut short-term rates to boost their economies. Historically, an overseas bond selloff would have had a minimal impact on Asia, because most companies borrowed from banks. But in recent years, big companies have tapped global bond investors for cash. The shift from banks to bonds occurred in 2009 at the height of the financial crisis. That year, bond issuance in Asia nearly doubled, while bank loans fell almost 7%, according to data provider Dealogic.
Home loan size surges as buyers pile on debt: First home buyers in NSW are loading up on nearly 25 per cent more debt than they were when the Reserve Bank began cutting official interest rates, as buyers scramble to get a foot in the door as house prices soar. They are, on average, borrowing $68,400 more today than they were three and a half years ago, when RBA governor Glenn Stevens kicked off the round of interest rate cuts that have put a rocket under house prices. The average new loan for a first home buyer has risen 23 per cent over this period to $362,000, significantly outpacing growth in wages, as buyers across the board take out bigger loans in response to very cheap debt. Overall, the average loan size in NSW has jumped by 18 per cent since late 2011, to $384,500, Bureau of Statistics figures showed this week.
Thai trafficking crisis: Thousands held in offshore and jungle camps - On Sunday, two boats carrying 500 Rohingya floated ashore in Aceh, Indonesia. One of the boats was packed with 430 people. The incident is the latest in a crisis that has swept the region and has revealed a widespread human trafficking network of onshore and offshore camps holding thousands of people. On 1 May police uncovered a mass grave in Thailand's south. It contained 26 bodies of migrants from Myanmar and Bangladesh. Since then, shallow graves have been uncovered across Songkhla province in southern Thailand near the Malaysian border. Advocacy groups warn that recent discoveries many only be the tip of the iceberg. Many of the dead are from the long-persecuted Rohingya communities in Myanmar and Bangladesh; over 100,000 have been forced into camps in Myanmar since 2012. An estimated 25,000 Rohingya and Bangladeshis boarded smugglers' boats in the first three months of the year, according to the UNHCR. That's almost double the figure from the same time last year. Well-established trafficking networks have taken advantage of the immense demand, smuggling people to southern Thailand and Malaysia. After the initial voyage from Bangladesh or Myanmar, the traffickers move the migrants into jungle camps or islands, or onto large holding boats of up to 1000 people, where they wait for family members to pay a ransom for their release. If family don't pay, they're sold to the highest bidder, often into sex slavery or slavery on fishing trawlers (see the Environmental Justice Foundation's Slavery at Sea report).
As Global Number of Pupils Soars, Education Falls Behind - A quarter of a century ago, barely half the children of primary school age in sub-Saharan Africa were enrolled in school. By 2012 the share was 78 percent. In South Asia, primary school enrollment jumped to 94 percent from 75 percent over the same period. This didn’t happen by chance. Policy makers around the world have come to understand the importance of learning for every aspect of human development. Universal primary education was one of the United Nations’ core Millennium Development Goals, which mobilized large amounts of aid in the first decade of the century for poor countries to expand access. Despite this phenomenal advance, however, a peek under the headline statistics suggests that much of the world has, in fact, progressed little. If the challenge was to provide a minimum standard of education for all, what looks like an enormous improvement too often amounted to a stunning failure. “We’ve made substantial progress around the globe in sending people to school,” said Eric Hanushek, an expert on the economics of education at Stanford University. “But a large number of people who have gone to school haven’t learned anything.” Can the world do better? Experts and diplomats have been working for two years to create a set of Sustainable Development Goals to succeed the previous millennium goals in guiding development strategy and steering international aid over the next 15 years. The targets are expected to be formally adopted by the United Nations in September.
Chief Economist for One of the World’s Largest Banks: “The World Economy Is Like An Ocean Liner Without Lifeboats. If Another Recession Hits, It Could Be A Truly Titanic Struggle For Policymakers” -- HSBC is the world’s largest bank outside of the U.S. and China, the largest in the UK, and the 9th largest bank in the world overall. HSBC’s chief economist Stephen King wrote today in a note to clients: The world economy is like an ocean liner without lifeboats. If another recession hits, it could be a truly titanic struggle for policymakers. King notes: Whereas previous recoveries have enabled monetary and fiscal policymakers to replenish their ammunition, this recovery — both in the US and elsewhere — has been distinguished by a persistent munitions shortage. This is a major problem. In all recessions since the 1970s, the US Fed funds rate has fallen by a minimum of 5 percentage points. That kind of traditional stimulus is now completely ruled out. King points out that – notwithstanding 7 years of extraordinary measures by the Fed and other central banks – Treasury yields haven’t risen, the budget deficit isn’t falling, and welfare payments are still rising. Why? Because the government has been doing the wrong thing ever since 2008
Argentina sues Citigroup over debt repayments - Citigroup has said it has been sued by Argentina and that some employees could face criminal charges there due to a court battle between the South American nation and US hedge funds. Argentinian officials have since late March “taken certain adverse actions against Citi Argentina, including filing a lawsuit against Citi Argentina and instituting a suspension of certain activities”, the US bank said in a filing with the Securities and Exchange Commission. Additional potential sanctions include “the loss of licences to operate in Argentina and criminal charges against bank employees”, Citigroup added. Citigroup’s travails come amid longstanding litigation between Argentina and US hedge funds NML Capital and Aurelius Capital Management, which did not accept a restructuring deal of Argentinian debt. The funds seek $1.3bn (£830m) from Argentina. US district court judge Thomas Griesa has repeatedly backed the funds’ campaign to attain full debt repayment, ruling that Buenos Aires cannot make payments on the restructured debt to other creditors until it pays the so-called “holdout” hedge funds first. On 12 March Griesa barred Citigroup from handling payments as the custodian of Argentinian bonds. The bank, the nation’s fourth-largest by assets, subsequently announced plans to exit the Argentinian custody business. After Citi’s announcement, Griesa permitted the US bank to handle two more payments of interests as custodian while it exits the business. However, Argentina has dismissed the US holdouts as “vulture” funds and essentially ignored Griesa’s rulings.
Venezuela Central Bank Reserves Fall Below $18 Billion as Bolivar Currency Falls Past 300 to the Dollar: Venezuela's international reserves fell through the psychological level of $18 billion -- down over $6 billion since March -- marking a new low since 2003. With heavy foreign debt burdens, falling crude production, falling crude production, increased domestic usage -- gasoline sells for less than a penny a gallon at the black market dollar rate -- Venzuela's foreign reserves have fallen to $17.875 billion as of May 13. That is the lowest level of foreign reserves for the founding OPEC member since 2003. At the same time, the Central Bank has increased the supply of bolivars in circulation (M2) in Venezuela 69% in the last 12 months, adding to rampant inflation that local investment bank Caracas Capital Markets now clocks at 165%. Those multiplying bolivars are chasing an ever smaller amount of dollars, driving the free market rate of dollars to pass 300 to the dollar on Wednesday. The currency has lost 50% of its value in less than 6 months, going from 150 bolivars to the dollar on November 28 to 300 to the dollar on May 13, says Dallen. "It previously took 11 months to fall from 75 to 150," says Russ Dallen of investment bank Caracas Capital Markets. The reserves have now fallen over $6 billion since their March high. Not adding confidence to the accuracy of its numbers, on May 4, the Central Bank reported that reserves were $19.799 billion but then erased that number and changed it to a full $1 billion lower at $18.799 a day later with no explanation. By way of comparison, Brazil has $362.74 billion in foreign reserves, Peru has $60.97 billion, Colombia has $46.54 billion, Chile has $38.03 billion, and Argentina has $31.49 billion, according to the IMF's March statistics.
Ukraine Rebels Nationalize Banks, Drawing the Ire of the US & World Bankers: In a tiny corner of Eastern Europe, a fledgling Republic struggling with the day-to-day hurdles of warfare and shaky ceasefires, has succeeded in doing what has long been overdue in the most powerful nation on the face of the earth – it has nationalized its out-of-control banks and put them to use for the good of the people. While the DPR was not faced with a privatized central bank such as the United States and other nations due to the fact that DPR is a breakaway bloc and a new nation separated from the Kiev central bank, it was nonetheless host to a number of larger banking institutions that not only parasitized the people of DPR and Ukraine but also did nothing to improve the infrastructure of these areas or the living standards of the people there. Emerging out of the stage of mere bands of militias and governing committees, the Donetsk People’s Republic is now in the process of putting together a formal government. Its plans to nationalize banks that have parasitized Ukraine for years have no doubt drawn the ire of not only the oligarchs that own those banks but the Anglo-American banking cartel that essentially owns the United States and NATO countries and who are bent on world hegemony and submission to their will. The plans to nationalize banks within the borders of the DPR were announced as early as January, 2015. By April 2015, however, those banks have now been nationalized and the oligarch owners castrated in their ability to manipulate the economy and political sphere, at least in this specific instance.
Bond Rout Deepens to $433 Billion as Bull Positions Unwound - Losses from the worst global debt-market slump in two years deepened to $433 billion as investors begin to ponder how high yields will climb before stabilizing. The value of the world’s fixed-income markets dropped to $45.07 trillion on Tuesday from $45.51 trillion on April 17, according to a Bank of America Merrill Lynch index. Record central-bank stimulus had sent investors piling into debt at the same time that dealers pulled back from making markets -- a combination that saw investors paying a price for holding bonds with yields not far from record lows and the Federal Reserve discussing an increase in U.S. interest rates. “People fell into a terrible complacency as yields fell to incredibly low levels with central banks pushing on rates,” said Christopher Sullivan, who oversees $2.3 billion as chief investment officer at United Nations Federal Credit Union in New York. “They figured they would be able to get out before the tide turned, but the rug has been pulled out, catching a lot of people off guard and exacerbating the move.” Investors in U.S. government debt did get a reprieve Tuesday. Yields fell after the Treasury Department’s auction of three-year notes demonstrated there’s no buyer’s strike in the bond market. Treasury auctions of 10- and 30-year securities set for Wednesday and Thursday move prove to be tougher sells. The benchmark 10-year Treasury note was little changed at 6:22 a.m. London time on Wednesday, with the yield at 2.25 percent.
Bund “tantrum” warns of future accidents - For decades, the German bund market was an island of stability in a sea of financial risk and uncertainty, but not any more. In recent weeks, the sharp rise in bund yields has been at the epicentre of global bond market turbulence, with its tremors spreading not only to peripheral eurozone bond markets and the euro, but also to US treasuries, oil prices and the dollar. So far, credit markets and global equities have been hardly affected, but any further disruption in the bond markets would probably cause trouble in risk assets as well. The sudden reversal in bond markets in the middle of April, coming immediately after the financial markets were said by some commentators to be “running out of bonds to buy” has been one of the sharpest sell-offs seen in fixed income since 2008. It is a salutary reminder of the much bigger shock that might occur when the central banks finally abandon their zero interest rate policies, though this still does not seem imminent. What explains the recent “bund tantrum”? Its causes can be traced back to the summer of 2014, when oil prices suddenly collapsed. With headline inflation rates plummeting, fears of “bad deflation” spread like wildfire, especially in the eurozone. Eventually, the ECB adopted a major regime change, culminating in the announcement of a €1tn programme of sovereign bond purchases on 22 January. The initial response of financial markets to these events seemed well justified. Led by the eurozone, government bond yields trended sharply downwards, and the euro and dollar exchange rates adjusted appropriately.After that, however, the bond and currency markets went much further than they had done in those earlier examples of QE. By mid April, 10 year bund yields had fallen to 0.1 per cent, and all German government bond yields under 7 years duration were actually negative. The bund market seemed to fit one definition of a “bubble”, in that no fundamental economic explanation seemed capable of explaining such low nominal yields.
Draghi says ECB will not stop short in QE plan - The European Central Bank will not stop short in rolling out its €1 trillion money printing scheme, its president said, playing down fears that quantitative easing could blow price bubbles. Mario Draghi's clear commitment was delivered in a speech at the International Monetary Fund in Washington. His comments show there is little prospect of paring back the fledgling programme that was launched despite the reservations of euro zone paymaster Germany. "After almost seven years of a debilitating sequence of crises, firms and households are very hesitant to take on economic risk," Draghi told an audience that included IMF chief Christine Lagarde. "For this reason quite some time is needed before we can declare success," he said. Draghi did not comment on tense debt talks underway between Greece and international creditors, which remain a key threat to the euro zone economy. Draghi said that although the ECB's €60 billion a month of purchases, chiefly of government bonds, were lifting asset prices and confidence, he also wanted them to boost investment and price inflation.
Eurozone GDP Growth Accelerates, Boosted by France, Italy - WSJ: A return to expansion in France and Italy helped boost eurozone economic growth in the first three months of 2015 to its fastest pace in almost two years, broadening a modest revival that had previously been heavily reliant on Germany. For the first time since the first half of 2010, all four of the eurozone’s largest economies recorded growth. And for the first time since the first quarter of 2011, the currency area’s economy grew more rapidly than both the U.S. and the U.K. That combination of faster and more evenly spread growth will feed hopes that 2015 could mark a decisive year for the eurozone in its efforts to recover from its debt crisis, aided by fresh stimulus from the European Central Bank, lower oil prices and signs that bank lending may be set to increase after years of decline. However, policy makers have openly expressed worries that the recovery may not be sustained, citing high unemployment, high government and corporate debt burdens, banking-system problems and weak investment spending. They contend that politically difficult overhauls in France and Italy, and an increase in investment in crumbling infrastructure in Germany and elsewhere, are the only way to achieve lasting growth in Europe. The combined gross domestic product of the 19 countries that shared the euro was 0.4% higher in the first quarter than in the final three months of 2014, the European Union’s statistics agency said Wednesday. That marked a pickup from the 0.3% growth recorded in the final quarter of last year, but was a slightly weaker outcome than the 0.5% rate forecast by many economists. On an annualized basis, the economy grew 1.6%.
European GDP Growth Trounces America In Q1, Biggest Rise In 4 Years; Greece Back In Recession -- While the US economy was crushed by harsh snow in Q1, with its GDP set to be revised to nearly -1.0% (yes, we know the real reason was the collapse in Chinese end demand and the soaring dollar but don't tell the Fed), Europe must have had a very balmy winter, because as Eurostat reported earlier today, Europe grew (and considering Europe estimates the "benefit" for prostitution and illegal drugs to the economy, we use the term loosely) 0.4% in the first quarter, a 1.6% annualized growth rate, in line with expectations, up from 0.3% last quarter and a year ago, and tied for the highest GDP print in 4 years. Some other statistics from the WSJ: for the first time since the first half of 2010, all four of the Eurozone’s largest economies recorded growth, and for the first time since the first quarter of 2011, the currency area’s economy grew more rapidly than both the U.S. and the U.K. Then again this is perhaps the 3rd false dawn for the Eurozone in the past 5 years.
Spain's public debt rises to over 1 trillion euros in March (Xinhua) -- Spanish public debt stood at 1.047 trillion euros (1.196 trillion U.S. dollars) in March representing 98.9 percent of the country's gross domestic product (GDP), the Bank of Spain reported on Thursday. The debt rose by 6.283 billion euros from February to March, while on a year-on-year basis the debt rose by 51.317 billion euros, the bank said. According to the Spanish government predictions, which were revised in April, Spain's public debt would stand at 98.9 percent of the country's GDP in 2015, a figure that has reached in the first quarter of the year. In 2016 the debt would fall to 98.5 percent while in 2018 it would fall to 93.2 percent thanks to a better performance of the economy that would involve a rise in domestic demand and an increase in job opportunities, among other improvements.
Bad debt at Italian banks rises to 189 billion euros in March - (Reuters) – Non-performing loans at Italian banks totalled 189.5 billion euros (137 billion pounds) in March, up 14.9 percent from a year earlier, central bank data showed at a time when the government is studying ways to help domestic banks offload bad loans. Loans least likely to be repaid, or “sofferenze”, were up 15.3 percent in February at 187.3 billion euros. In a separate report published earlier, the central bank said that lending by Italian lenders to non-financial companies, which has been falling since May 2012, dropped 2.2 percent in March.
Demographic Devastation: Italy's Birth Rate Drops To 150 Year Low -- Italian women would "like to have more [children], but the conditions just aren't good enough," laments one new mother as CBS News reports, official figures show that in 2014 there were fewer babies born in Italy than at any time since 1861. "Nowadays people don't want to raise their child in poverty," but Pope Francis had a different opinion, asThe Guardian reported, "a society with a greedy generation, that doesn't want to surround itself with children, that considers them above all worrisome, a weight, a risk, is a depressed society." Relative to Europe's top-'producing' nation - Azerbaijan - and its 18.3 births per 1,000 inhabitants, He may well be right but the Italians are in 'depressed' company along with Portugal, Greece, and Spain at the lower end of the EU spectrum.
Frontex can’t solve the Mediterranean migration crisis on its own – here’s why -- Europe in the past few weeks has been shocked by a record high in the number of migrants dying in the Mediterranean Sea. Facing this grave situation, EU political leaders pledged to work together to tackle the issue in an EU extraordinary summit held at the end of April. They proposed to triple the fund for Frontex, which has been coordinating two joint border operations – Triton and Poseidon – in the Mediterranean. However, these operations alone will not resolve the issue. Frontex operations alone cannot be a solution as the agency does not have the scope or ability to address the causes of the current migration crisis. It is too easy for us to think that once there is a problem at a border – the Mediterranean in this context – that the only solution needed is to strengthen border checks and surveillance. It’s not that simple. What is needed is to focus on why people are migrating in the first instance – migration does not start and end at the border. When we start to understand this, we start to realise that the impact of any operations, whether search-and-rescue or border control, will always be very limited. The EU has addressed other areas that are linked to this, such as the issues of asylum application and the resettlement of migrants in need of protection and the need for engagement with countries surrounding Libya.
Meet Europe's Hardest Workers: The, er, Greeks --One of the more astounding facts I routinely come across about Europe is that the Greeks work the most number of hours going by OECD data.This finding, of course, flies in the face of common assumptions nowadays that the Greeks are lazy people whose lack of effort has precipitated the economic crisis it's been facing for years and years. Perhaps the Greeks are the European equivalents of James Brown, the hardest working man in show business? But I digress. The sheer number of hours worked gives very little indication of worker productivity. First, they may be working a lot of hours doing grunt work that does not yield much in terms of economic output. That is, many Greeks may be stuck doing barely sophisticated manual labor. Second, when labor is not matched with adequate capital, then total factor productivity may suffer. Sure they work a lot, but again, they do not produce much without the aid of sophisticated machinery or computers. This finding has prompted much griping in the Greek press that stereotypes about them are unjustified. Meanwhile, the Germans and Dutch allegedly do not deserve their reputation for being hard working people going by the numbers presented above:
Greece: Suspicions that the central bank undermines government!: A report by the efsyn newspaper revealing subversive leaks by the Governor of the Bank of Greece, Yannis Stournaras, to particular media, caused strong turbulences in the political and banking system. Specifically, the letter from the press office of Mr. Stournaras to a known journalist, entitled "The account of 100 days," attempts to present the image of an already bankrupt country before any discussion about a possible default. For its part, the government underlined that if the report is correct it would be a blow against the independence of the Bank of Greece, and asked from the leadership of the Bank to deny the information. Government sources said that, otherwise, the Bank of Greece should initiate accountability procedures in order to stop some people inside the Bank to undermine the government in such a critical time for the country. Thereby, they opened the debate for removing Yannis Stournaras. The Bank of Greece already made an announcement through which denied such actions.
Schaeuble Says Greece Playing Chicken With Default Risk -- German Finance Minister Wolfgang Schaeuble warned that governments can sometimes default by accident, in a jab at Greek officials still holding out for a better deal from creditors as their cash supplies run critically low. Greece is preparing for a meeting of euro-region finance ministers on Monday with the European Central Bank threatening to restrict the country’s access to bank funding unless there’s progress toward an aid deal. Greece’s creditors say the government’s plans for fixing the economy aren’t yet detailed enough to justify more financial support. “Experience elsewhere in the world has shown that a country can suddenly become unable to pay its bills,” Schaeuble said in an interview with Frankfurter Allgemeine Sonntagszeitung published Saturday. Schaeuble said he’ll do everything he can to keep Greece in the euro. “If it fails, it won’t be because of us,” he added. Greece’s Deputy Foreign Minister Euclid Tsakalotos, who is in charge of negotiations, said “any delay in achieving a compromise has to do with one and only one reason, and this is the political differences between the government and the institutions.” His comments were made in an interview with the daily newspaper Avgi.
Which Countries Stand to Lose Big from a Greek Default? - The IMF has turned up the heat on Greece’s Eurozone neighbors, calling on them to write off “significant amounts” of Greek sovereign debt. Writing off debt, however, doesn’t make the pain disappear—it transfers it to the creditors. No doubt, Greece’s sovereign creditors, which now own 2/3 of Greece’s €324 billion debt, are in a much stronger position to bear that pain than Greece is. Nevertheless, we are talking real money here—2% of GDP for these creditors. Germany, naturally, would bear the largest potential loss—€58 billion, or 1.9% of GDP. But as a percentage of GDP, little Slovenia has the most at risk—2.6%.The most worrying case among the creditors, though, is heavily indebted Italy, which would bear up to €39 billion in losses, or 2.4% of GDP. Italy’s debt dynamics are ugly as is—the FT’s Wolfgang Münchau called them “unsustainable” last September, and not much has improved since then. The IMF expects only 0.5% growth in Italy this year. As shown in the bottom figure above, Italy’s IMF-projected new net debt for this year would more than double, from €35 billion to €74 billion, on a full Greek default—its highest annual net-debt increase since 2009. With a Greek exit from the Eurozone, Italy will have the currency union’s second highest net debt to GDP ratio, at 114%—just behind Portugal’s 119%. With the Bank of Italy buying up Italian debt under the ECB’s new quantitative easing program, the markets may decide to accept this with equanimity. Yet assuming that a Greek default is accompanied by Grexit, this can’t be taken for granted. Risk-shifting only works as long as the shiftees have the ability and willingness to bear it, and a Greek default will, around the Eurozone, undermine both.
Bulgaria most at risk from Grexit contagion, Morgan Stanley says: Bulgaria has more to lose than its southeast European neighbors Romania and Serbia in a potential collapse of the Greek economy, Morgan Stanley said in a report. “Greek banks hold a significant share in Bulgaria, Romania and Serbia, with the highest share of foreign claims being in Bulgaria,” Morgan Stanley Research said in the report on Monday. “While the direct economic impact of Grexit looks manageable, we think that the banks are by far the most serious potential channel of contagion.” Greek banks have about 14 percent of their business on average in the southeastern European markets, according to the report. They hold a market share of around 25 percent and their operations are funded with deposits of around 15 billion euros ($16.7 billion), Morgan Stanley said. Greek lenders constitute 33 percent of foreign claims in Bulgaria, 18 percent in Romania and 23 percent in Serbia, it said.
Critical choices loom ahead of Eurogroup, IMF repayment: Greek officials are bracing for a difficult Eurogroup summit in Brussels on Monday after what promises to be a weekend of feverish negotiations with representatives of Greece’s international creditors as European officials increase the pressure on Athens to compromise and avert a default. Prime Minister Alexis Tsipras has been engaged in a flurry of telephone diplomacy in a bid to drum up political support. Meanwhile prominent officials underlined the risks Greece is facing as its coffers run dry and financial obligations loom, notably a repayment of some 750 million euros to the International Monetary Fund on Tuesday. Greek officials have expressed the government’s intention to pay the IMF but according to sources some are in favor of not paying if the outcome of Monday's Eurogroup is not satisfactory. Such a move would lead to Greece being declared bankrupt within a month with capital controls likely to be imposed on Greek banks much sooner than that to avert a bank run. European officials suggested that Greece should be cautious. “Experience in other parts of the world has shown that a country can suddenly slide into bankruptcy,” German Finance Minister Wolfgang Schaeuble was quoted as telling Frankfurter Allgemeine Zeitung. Other European officials made less dramatic statements, with European Economic and Monetary Affairs Commissioner Pierre Moscovici stressing that reforms are not progressing quickly enough and Eurogroup President Jeroen Dijsselbloem saying Monday’s Eurogroup “won’t be decisive.” Although a decision that will unlock loan money is not expected on Monday, at the very least Athens is hoping for a statement of support that will allow the European Central Bank to provide some liquidity relief, or at least not turn the screws further.
I.M.F. and Central Bank Loom Large Over Greece’s Debt Talks - Greek leaders have fought fiercely in recent months with politicians from other European countries over relief on Greece’s vast debt load. Yet the power to decide the fate of Greece lies not just in the hands of these national governments, but also with unelected officials at two powerful institutions: the European Central Bank and the International Monetary Fund. Each is a creditor to Greece, and each is expecting the country to repay it billions of dollars of debt in the coming weeks. The influence of the E.C.B. and the I.M.F. will be felt behind the scenes on Monday, when finance ministers from Greece and other European nations meet in their latest effort to break an impasse that is paralyzing the Greek economy and frightening global markets. Greece is expected to repay 750 million euros, or $840 million, to the monetary fund on Tuesday as scheduled. For the rest of the year, however, its debt repayments to the fund and the central bank total nearly €12 billion....Discussions in the Greek government have included assessing the pros and cons of not paying the central bank and the monetary fund ... a few of the debt specialists ... contend that they have a strong intellectual case for defaulting on debt owed to the central bank and the monetary fund. For too long, they assert, Greece has been stuck in a cycle of having to borrow more money to pay off maturing debts. And each time it borrows more, it must accept economic austerity measures that deflate its economy. A result, they argue, is that five years after Greece’s first bailout, the nation’s economy has contracted by a quarter, and its debt burden is approaching 200 percent of its gross domestic product.
Tsipras: Agreement Only According to Greek People's Mandate - After an eight-hour cabinet meeting led by Prime Minister Alexis Tsipras regarding Monday’s crucial Eurogroup, there was no official statement other that the reiteration that the Greek government will not sign an agreement with creditors unless it is within the framework of the people’s mandate. Coming out of the meeting, Defense Minister Panos Kammenos appeared optimistic, saying that the government continues its work united and determined. When asked about the possibility of national elections, Kammenos said that, “The government has a fresh people’s mandate and it will follow along these lines.” The prime minister described to participating ministers the expectations regarding the ongoing negotiations. “At Monday’s Eurogroup we want t have a clear statement of the progress made in the last period of negotiations,” Tsipras said according to Maximos Mansion sources. However, in any case, any agreement reached must be within the framework of the people’s mandate, he clarified. The same sources noted that the prime minister and cabinet believe that Greece has made recorded efforts and is totally consistent on the fulfillment of its obligations, proving its willingness to come to an agreement — a mutually beneficial agreement — and both sides should work along this goal. A positive message from the Eurogroup session will send a message to the European Central Bank to relax its liquidity restrictions on Greece, the government sources estimate.
Greece's 'war cabinet' prepares to battle EU creditors as anger mounts - Greece's "war cabinet" has resolved to defy the European creditor powers after a nine-hour meeting on Sunday, ensuring a crescendo of brinkmanship as the increasingly bitter fight comes to a head this month. Premier Alexis Tsipras and the leading figures of his Syriza movement agreed to defend their "red lines" on pensions and collective bargaining and prepare for battle whatever the consequences, deeming the olive-branch policy of recent weeks to have reached a dead end. "We have agreed on a tougher strategy to stop making compromises. We were unified and we have a spring our step once again," said one participant. The Syriza government knows that this an extremely high-risk strategy. The Greek treasury is already empty and emergency funds seized from local authorities and state entities will soon run out. Greece's mayors warned over the weekend that they would not release any more funds to the central government. The Greek finance ministry must pay the International Monetary Fund €750m (£544m) on Tuesday, the first of an escalating set of deadlines running into August.
Greece says deal will be 'difficult' at Eurogroup meeting - (Reuters) - Finance Minister Yanis Varoufakis acknowledged that a deal to ease Greece's cash crunch was not likely at a meeting of euro zone finance ministers later on Monday despite progress in talks with lenders on some issues.Greece is under growing pressure to reach agreement with lenders to avoid financial chaos though many Greeks also want the government to stick to its "red lines" of avoiding further pension cuts and labor reforms making it easier to fire workers. A 750 million euro debt repayment to the IMF falls due on Tuesday but Varoufakis said a deal that would provide some liquidity relief for Greece was more likely in the coming days. "Τhe likelihood is not ruled out. The messages we are getting are that it will be difficult," Varoufakis told Sto Kokkino radio on Monday. Varoufakis, who will take part in the meeting, said the two sides had converged on many issues. "The Greek government is struggling in a very tough negotiating fight to achieve an agreement that will not only be an agreement to have a disbursement (of aid) but one that will deliver a substantive hit to the crisis," he said. "I think the solution will be given in the coming days and not necessarily today. We will do whatever we can to achieve (liquidity) relief today."
Schaeuble warns defaults can surprise as Greece crams for talks -- German Finance Minister Wolfgang Schaeuble warned that sovereign defaults can catch officials off guard as Greece prepares for a finance ministers’ meeting Monday with the European Central Bank threatening to tighten the screw. Greek officials are huddling with their creditors before the gathering in Brussels which could determine whether the ECB restricts the country’s access to emergency funding. ECB policy makers are looking for signs of concrete progress from the talks to justify maintaining access to the bank’s Emergency Liquidity Assistance. “Experience elsewhere in the world has shown that a country can suddenly become unable to pay its bills,” Schaeuble said in an interview with Frankfurter Allgemeine Sonntagszeitung published Saturday. Schaeuble said he’ll do everything he can to keep Greece in the euro. “If it fails, it won’t be because of us,” he added. The ECB is seeking significant progress toward an aid agreement before its next weekly review of Greece’s emergency funding with some Governing Council members calling for the discounts on collateral posted by Greek banks to be increased. On May 6 policy makers discussed tightening access to funds if Greece’s stalemate with its creditors drags on. “European institutions plus the IMF and Greek authorities are trying to find a solution, but the solution is in the hands of Greek authorities,” European Commission Vice President Jyrki Katainen said. Officials from Greece, the euro area and the International Monetary Fund will hold discussions in Brussels over the weekend, a Greek official said. While both sides have declared progress in the last few days, Dutch Finance Minister Jeroen Dijsselbloem, who leads the euro-area finance ministers’ group, told Corriere della Sera Greece hasn’t yet done enough to earn more aid. “We have made progress, but we are not very close to an agreement,”
IMF draws up contingency plans for Greek default - — The International Monetary Fund is working with national authorities in southeastern Europe on contingency plans for a Greek default, a senior fund official said — a rare public admission that regulators are preparing for the potential failure to agree on continued aid for Athens. Greek banks are big players in some of its neighbors’ financial systems. In Bulgaria, subsidiaries of National Bank of Greece, Alpha Bank, Piraeus Bank and Eurobank Ergasias own around 22% of banking assets, roughly the same as Greek banks own in Macedonia. Greek banks are also active in Romania, Albania and Serbia. “We are in a dialogue with all of these countries,” said Jörg Decressin, deputy director of the IMF’s Europe department. “We are talking with them about the contingency plans they have, what measures they can take.” As part of the discussions, the IMF has asked national supervisors to ensure that subsidiaries of Greek banks have enough assets that they can exchange for emergency financing at their own central banks—in case financing from their parent institutions is suddenly cut off—and that deposit-insurance funds are at sufficient levels, Decressin said.
Greece Authorizes €750 Million Payment to IMF Despite Failing to Get Concession Sought - Yves Smith - Today, Greece blinked. Despite leaks that suggested the government had decided to take a tougher line with the Eurogroup and was prepared to make a voluntary default on its €750 million payment to the IMF due tomorrow, Greek officials relented and told the central bank to send the funds onward. We had indicated in our post earlier today that Greece may have made a tactical error, in that by saying that it had enough funds available, it was making clear that any failure to pay was elective. The reason is that the ruling coalition is getting close to the point of not having sufficient cash to meet salary and pension payments. And even if Greece manages to make its end of May pension and salary payments in full, it’s hard to see how the government gets through June, when it has €1.5 billion coming due to the IMF with the first payment, €300 million, falling on June 5. If forced to resort to paying its citizens in funny money, it runs the dual risk of deepening the contraction and denting domestic support. However, Greece, like the Eurozone, has made an art form of pulling rabbits out of hats. Nothing seems to have changed today, save exposing that the bluster in the Greek media and to friendly foreign reporters like Ambrose Evans-Pritchard, was not matched by action. Perhaps that reflects a pattern that we’ve seen before, that the messaging to the ruling coalition’s domestic audience is far more aggressive than what the government is prepared to do in practice. We’ve seen more than once how Greek negotiators, including Tsipras, will raise issues with creditors, then take a conciliatory line, but later make more defiant statements at home, seemingly walking back the position he taken with counterparties.
Greece orders IMF payment as eurogroup meets - FT.com: Greece’s finance ministry ordered a €750m payment to the International Monetary Fund, ending days of uncertainty over whether Athens would use the instalment as a bargaining chip in ongoing talks with its creditors. Ministry officials said they had sent a payment order to the government’s national accounts office to ensure it would arrive in the IMF’s coffers by Tuesday, when the loan repayment falls due. “The order to pay has been made,” said one finance ministry official. More video Some members of the governing hard-left Syriza party had pushed ministers to withhold the payment until eurozone finance ministers meeting in Brussels agreed to endorse progress made by bailout negotiatorsin recent days. Athens has lobbied furiously for such a statement, which officials believe would allow the European Central Bank to lift the ceiling on its issuance of short-term debt, which would provide more breathing room for the cash-strapped government. But according to officials involved in the Brussels meeting, Yanis Varoufakis, the Greek finance minister, confirmed Athens would make the payment during the hour-long session. Ministers had only a perfunctory debate over the Greek programme, and issued a statement that was far more lukewarm than Athens had hoped — welcoming the improved atmosphere in the talks but warning that “more time and effort are needed to bridge the gaps”. Such language is not expected to give the ECB the leeway it would need to lift its restrictions on Athens’ ability to sell treasury bills, which are almost exclusively purchased by Greek banks.
Greece Moves to Pay Debt, but European Finance Ministers Unsatisfied - NYTimes.com: The government of Greece, quickly running out of cash, moved on Monday to quell fears of an imminent default on its debts, authorizing its treasury to make a big loan payment to the International Monetary Fund. While Athens once again managed to pull together enough cash to avoid a default, it is not clear how much longer Greece can continue to scrape by.Unless creditors agree to more aid, Greece will have trouble making a series of looming debt payments. The continuing standoff over the aid — and the uncertainty it has created — has darkened the outlook for the country’s economy, which risks another downturn.Despite word of payment, Greece and its creditors on Monday remained at an impasse over a deal to free up fresh financial aid for the embattled country. Before releasing the aid, Greece’s creditors have been demanding that the government make economic overhauls in areas like pensions, labor rules and taxation. Eurozone finance ministers, who were joined by representatives of the I.M.F. and the European Central Bank, indicated that Greece had made some progress on a proposed list of economic overhauls since an acrimonious meeting two weeks ago in Riga, Latvia. But the finance ministers, known as the Eurogroup, said that Athens would need to do more work before it could hope to receive any further loan aid under the country’s current bailout program.
Shell Game? How Greece’s Latest IMF Repayment Cost Athens Very Little - Greece‘s latest bailout repayment to the International Monetary Fund may turn out to be one of the debt-saddled nation’s least expensive payments ever. With its $840 million payment Tuesday, Athens bought itself more time to negotiate new bailout terms with its creditors without having to deplete the country’s piggy banks at home. It pulled off the feat largely by tapping an obscure pot of money: its currency reserves held at the IMF. Like the pea in a magician’s shell game, it’s a little hard to follow, but here’s how it works: Decades ago, the IMF created a unique currency called “Special Drawing Rights” as a foundation for financing emergency bailouts. Those SDRs are commitments to lend cash to member nations in need. The IMF’s 188 member countries are each allocated a certain number of SDRs based on the size of their vote at the fund, which is roughly determined by the size of their economy. (That’s another story completely.) When a country needs a bailout, the members agree to lend a share of those pooled SDR reserves. In 2009, as the financial crisis knocked down the global economy, the IMF’s shareholders believed the fund’s lending resources weren’t large enough to deal with the economic fallout and agreed to dramatically boost the fund’s emergency reserves. The IMF digitally created new SDRs, increasing each member country’s individual SDR reserves at the fund. And that meant collectively, the members committed to providing several hundred billion dollars more to the IMF’s emergency-financing kitty. Most countries had to account for that bigger potential call on emergency cash lending on their balance sheets. The U.S., for example, set aside more than $100 billion dollars to cover its larger commitment. At the same time, however, the SDR allocation didn’t require countries to send any actual cash to the IMF, unless they were called on to bail out member countries.
Greece and eurozone agree bailout extension - FT.com: Athens and its eurozone bailout lenders agreed an eleventh-hour deal to extend the country’s €172bn rescue programme for four months, ending weeks of uncertainty that threatened to spark a Greek bank run and bankrupt the country. The deal, reached at a make-or-break meeting of eurozone finance ministers on Friday night, leaves several important issues undecided — particularly what reform measures Athens must adopt in order to get €7.2bn in aid that comes with completing the current programme. The new Greek government is to submit those measures for review to the International Monetary Fund and EU institutions on Monday, and officials said if they were not adequate another eurogroup meeting could be called on Tuesday. Critically, Friday’s agreement commits Athens to the “successful completion” of the current bailout review, something the new Greek government has long vowed to avoid. “As long as the programme isn’t successfully completed, there will be no payout,” said Wolfgang Schäuble, the powerful German finance minister. Alexis Tsipras, the Greece prime minister said Friday’s agreement cancelled the austerity commitments made by a previous conservative-led government but warned of difficult times ahead. “We proved that Europe stands for mutually beneficial compromises — not for doling out punishments.” he said on Saturday. But Friday’s deal was not the end of the negotiations. “We will be entering a new, more substantive stage in our negotiations until we reach a final agreement to transition from the catastrophic policies of the Memoranda, to policies that will focus on development, employment and social cohesion,” he said Still, the agreement avoids what eurozone officials feared would be market turmoil if the bailout had expired at the end of next week and should stem the mounting deposit withdrawals from Greece’s banking sector, which officials said were reaching close to €800m per day, creating a situation at risk of becoming a full-scale bank run.
Greece Effectively Defaults To IMF Using SDR Reserves To "Repay" Fund; 1 Month Countdown Begins - When Monday’s Eurogroup meeting concluded without an agreement between Greece and its creditors, it should have been game over for Athens. With pensioners at their breaking point and with local governments reluctant to comply with a decree mandating a sweep of excess cash reserves, the idea that Greece would somehow be able to scrape together €750 million euros to make a scheduled payment to the IMF today seemed far-fetched at best which is whywe asked the following question Monday afternoon: Where, if not from local governments who have been extremely reluctant to comply with Athens' cash sweep decree, and if not from the IMF which will apparently not be paying itself tomorrow after all, is Greece going to get three quarters of a billion euros in the next 12 hours? We now know the answer to that question. As Bloomberg reports, citing Kathimerini, Greece tapped IMF reserves to pay .. well, to pay the IMF: Greece used up ~EU650m reserves from its SDR IMF holdings account to meet loan payment of ~EU750m due to Fund today, Kathimerini newspaper reports, without citing anyone. Reserves kept in IMF holdings account need to be replenished within one month. IMF agreed over weekend for their use, given Greece’s liquidity situation; without use of those reserves, payment due today wouldn’t be possible.
REPORT: The IMF won’t join in a third bailout for Greece -- The International Monetary Fund (IMF) is backing away from a potential third Greek bailout package, according to Spanish newspaper El Mundo. The paper cites a lack of "really effective action" and Athens' recent re-hiring of public employees who were previously made redundant under austerity measures as reasons for the IMF's stance. Every recent IMF repayment by Greece has been hotly anticipated, with analysts attempting to work out which of the major disbursements Athens will fail to make. El Mundo notes that the only countries which have previously defaulted with the IMF are Zimbabwe, Somalia and Sudan. If the report is accurate, that would leave any future deal completely in the hands of the Eurogroup (the bloc of eurozone finance ministers), the European Commission and the European Central Bank (ECB). Many Eurogroup members are already reluctant to foot the bill, and will not be happy to hear they're taking a bigger chunk. The current tranche of €7.2 billion ($8.05 billion, £5.17 billion) that's being negotiated with Greece's new government is the final instalment of the second bailout package. After that, any new deal would have to start afresh.
Tsipras calls emergency meeting as crisis-hit Greece plunges back into recession - Crisis-stricken Greece has fallen back into recession, after the economy contracted by 0.2pc in the first three months of the year. Figures from the country's official statistics agency showed the debt-laden economy was the third worst performer in the 19-country bloc after Estonia and Lithuania. The figures follow a 0.4pc contraction in the fourth quarter of last year, putting Greece officially back into recession. Greek Prime Minister Alexis Tsipras has called his third emergency meeting in four days on the back of the news. On Sunday, the Leftist government held a "war cabinet" reaffirming its desire to stick by pledges to raise wages and increase pensions for the poorest.On Sunday, the Leftist government held a "war cabinet" reaffirming its desire to stick by pledges to raise wages and increase pensions for the poorest. The European Commission was forced to slash its yearly growth forecast for Greece to just 0.5pc this year, from an earlier estimate of 2.5pc. This projection is still based the country managing to secure a bail-out deal with its creditors and remain in the eurozone. Greece briefly hit the heights as the eurozone's fastest-growing economy in the third quarter of 2014. But falling business confidence, eye-watering unemployment and persistent deflation has seen growth prospects take a tumble since snap elections were called in December.
Greece plays down referendum option, economy stutters: Greece’s government on Wednesday ruled out rushing to a referendum to secure public support for unpopular reforms, opting instead to make a final push for a compromise with lenders by the end of the month. Running out of both cash and options to pursue, Prime Minister Alexis Tsipras was to preside over his third cabinet meeting in four days later on Wednesday to seek a way out of an impasse in talks with lenders who refuse to dole out more aid. Adding further pressure on the government, data released on Wednesday showed the country slid back into a recession in the first quarter, just months after exiting a six-year depression. Analysts blamed the 0.2 percent decline in output largely on the hit to sentiment and demand from the standoff. For now, Tsipras’s government said its aim remained to strike a deal with its international creditors rather than turn to a referendum or early elections. At a cabinet meeting on Tuesday, Athens reiterated hopes for a deal by the end of the month - by which time it risks running out of cash without new funds. "We are working towards an honorable compromise," Interior Minister Nikos Voutsis told Mega TV. "An immediate recourse to a referendum or elections is not in our plans right now."
Greece’s hot summer -- Figures confirm the pattern already observed last month (which I discussed here), with a marked improvement in the primary balance achieved mostly via expenditure cuts and a more limited improvement in revenues. The State budget balance records a deficit of EUR 508 mn over January- April 2015, against the target of deficit of EUR 2.9 bn set in the 2015 budget, and significantly lower than for the same period of 2014 (when the deficit was EUR 1.15 bn). The State budget primary balance records instead a surplus of EUR 2.16 bn over the first four months of the year, against the target primary deficit of EUR 287 mn. This implies that in cumulative terms the State primary balance has over-performed the target by as much as EUR 2.45 bn. State Budget net revenues amounted to EUR 15.8 bn for the period January-April 2015, over performing the target by EUR 372 mn. Last month, the over-performance had been of EUR 94 mn (see here for details). For the month April alone, State Budget net revenues amounted to EUR 3.79 bn, over performing the monthly target by about EUR 278 mn. As for last month, the public investment budget’s net revenues played a key role in the improvement on the revenue side, over-performing the target by EUR 465 mn. However, the improvement in the ordinary revenues component observed last month is confirmed. Ordinary net revenues beat their target by EUR 494 mn this month, which may suggest that the revenues situation is slowly normalising. While on a cumulative basis ordinary budget net revenues are still short of target, the gap is now only EUR 92 mn compared to the EUR 584 mn undershooting recorded last month.
Greece’s Creditors Said to Seek 3 Billion-Euro Budget Cuts - Greece’s anti-austerity government needs to raise at least three billion euros ($3.4 billion) through additional fiscal measures by the end of this year to meet the minimum budget targets acceptable by creditors, an official with knowledge of the discussions said. The reductions would bring the primary budget surplus in 2015 to just over 1 percent of gross domestic product, a target Greek Interior Minister Nikos Voutsis said today is acceptable. Without any change in fiscal policy, Greece would end 2015 with a budget deficit of about 0.5 percent of GDP, the official said. The commission now predicts the country’s debt will be 174 percent of GDP next year, 15 percentage points above the level projected in February. And that assumes Prime Minister Alexis Tsipras reaches a deal to get previously agreed aid flowing by June. The commission predicts that as defined in the bailout program there will be almost no surplus. Budget cuts aren’t the only thorny issue in the negotiations over the disbursement of the next emergency loans tranche for the cash-strapped economy. Disagreements remain over the retirement age, pension cuts, privatizations and the government’s intention to reinstate collective bargaining restrictions in the labor market, the official said.
Creditors push for reform proposals as talks resume: Negotiations between Greece and its creditors resumed at the technical level via teleconference on Thursday. Meanwhile, with pressure for a deal growing as cash reserves dwindle, Finance Minister Yanis Varoufakis proposed that Greece push back the repayment of bonds held by the European Central Bank. The so-called Brussels Group, comprising representatives of the government and the country’s creditors, spoke by teleconference on Thursday. The Greek side was based at the Maximos Mansion while Varoufakis convened a separate meeting with his general secretaries at the ministry. According to sources, the technical talks focused on lingering differences between the two sides: the size of the budget gap, which will determine the extent of the measures that Greece will be obliged to take, pension and labor sector reforms, as well as changes to value-added tax. Another teleconference is understood to be planned for Friday with the Greek team expected to travel to Brussels over the weekend ahead of a possible face-to-face meeting on Monday. According to sources, creditors want Greece to present them with a list of proposed reforms in the coming days, preferably by Sunday. Earlier in the day government spokesman Gavriil Sakellaridis admitted that the creditors were pushing Greece on certain thorny issues including private sector wages which they continue to regard as too high. Varoufakis did not go into detail about reforms being discussed. But he told Parliament that VAT on the Greek islands, many of which enjoy a favorable status, will not be increased before summer.
Greek PM says won't back down from red lines in EU/IMF talks - Reuters: Greek Prime Minister Alexis Tsipras said on Friday his government would not back down from its red lines in negotiations with its foreign lenders but said a deal must be reached soon following months of talks. Athens is fast running out of cash and talks with European Union and IMF lenders on more aid have been deadlocked over their demands for Greece to implement reforms, including pension cuts and labor market liberalization. Tsipras said the two sides had largely agreed on fiscal targets and VAT rates, but disagreed on labor issues and pension reform. He said an accord should include low primary budget surplus targets for 2015-16 and a debt restructuring. "The deal must close there is no doubt about it," Tsipras told a conference. "However, some cannot have in the back of their minds the idea that, as time goes by, the Greek side's resilience will be tested and its red lines will fade out. "If some people have it in the back of their minds, they should forget it."
Varoufakis Has Futuristic Greek Debt Plan That "Fills Mario Draghi's Soul With Fear" -- In “Germany Gives Greece Grexit Referendum Greenlight,” we pointed to comments by German FinMin Wolfgang Schaeuble which seemed to indicate that the EU paymaster would like to see PM Tsipras put euro membership to a popular vote. Such a move could accelerate negotiations with creditors by effectively allowing Syriza to claim it hasn’t betrayed its support base, but a vote also risks plunging the country into turmoil should the gambit backfire (i.e. if Greeks unexpectedly vote to leave the currency bloc). Here’ Bloomberg with more: The German Finance Ministry is supporting the idea of a vote by Greek citizens to either accept the economic reforms being sought by creditors to receive a payout from the country’s bailout program or ultimately opt to leave the euro. A referendum could bring the conflict to a head after months of inconclusive talks between Greece and its creditors that have exasperated Germany and other euro-area countries. Public support for economic reforms might lead Greece toward a deal, while rejection could set the country on a path to leaving the euro. Of course no update on Hellenic hell would be complete without a bit of fire and brimstone from an increasingly unhinged Yanis Varoufakis who still believes the best solution when it comes to Greek debt is to package it all up and overnight it into the “distant future.” Via Reuters: Varoufakis first raised the idea of swapping Greek debt for growth-linked or perpetual bonds when his leftist government came to power earlier this year, But Athens has since dropped the proposal after it got a cool reception from euro zone partners. The outspoken minister, who has been sidelined in talks with European Union and International Monetary Fund lenders, brought it up again on Thursday, saying 27 billion euros of bonds owed to the ECB after 6.7 billion euros worth are repaid in July and August should be pushed back. "What must be done (is that) these 27 billion of bonds that are still held by the ECB should be taken from there and sent overnight to the distant future," he told parliament. "How could this be done? Through a swap.”
Britain’s political earthquake will create aftershocks for the UK and Europe: So David Cameron confounded the polls and won a thin but absolute majority in the House of Commons, while all his adversaries in England were shattered, as witnessed by the immediate resignation of the leaders of Labour (Ed Miliband), the Liberal Democrats (Nick Clegg) and even UKIP (Nigel Farage). But Nicola Sturgeon and the Scottish nationalists also triumphed, sweeping up 56 out of the 59 Scottish constituencies. The first consequence for the EU will surely be that Cameron will announce legislation to fix the date for the in-or-out referendum scheduled for 2017, with some discussion of whether it could be brought forward into 2016. This will be the easy part. Much more tricky will be the second step: to set out what Cameron actually wants, going beyond the vague rhetoric about “renegotiating a new settlement or better deal for the UK within a reformed EU” that he has relied on so far. Cameron’s demands to the EU institutions and other member states will most likely fall under the three key words he has been using: repatriation, renegotiation and reform. Repatriation in any strategic sense means deleting competences from the Lisbon Treaty for all member states. But Cameron’s own Balance of Competence Review went into this question thoroughly, and found no instance where there was a sound case for repatriation.


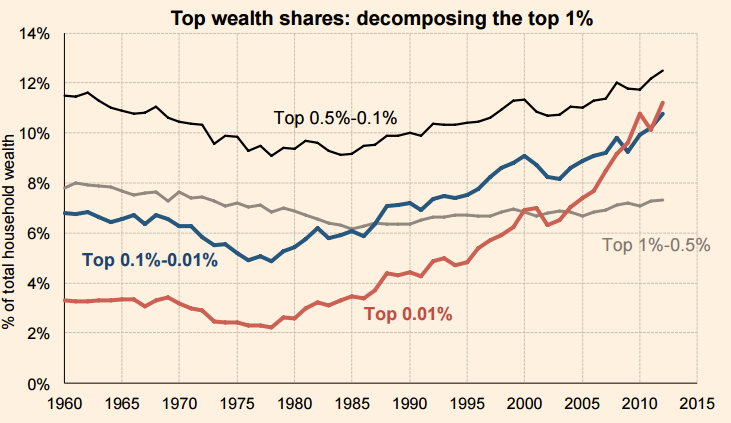
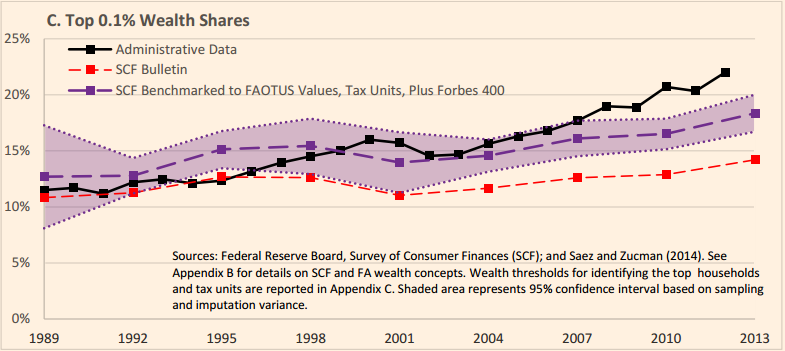
No comments:
Post a Comment